HOT TOPICS LIST
- MACD
- Fibonacci
- RSI
- Gann
- ADXR
- Stochastics
- Volume
- Triangles
- Futures
- Cycles
- Volatility
- ZIGZAG
- MESA
- Retracement
- Aroon
INDICATORS LIST
LIST OF TOPICS
PRINT THIS ARTICLE
by Billy Williams
Smart traders who understand the dynamics of technical analysis know that sometimes it pays to step back and look at the bigger picture for fresh perspectives, such as in the case of Valmont Industries.
Position: Buy
Billy Williams
Billy Williams has been trading the markets for 27 years, specializing in momentum trading with stocks and options.
PRINT THIS ARTICLE
TECHNICAL ANALYSIS
Valmont And Bigger-Picture Perspectives
02/28/12 09:05:38 AMby Billy Williams
Smart traders who understand the dynamics of technical analysis know that sometimes it pays to step back and look at the bigger picture for fresh perspectives, such as in the case of Valmont Industries.
Position: Buy
| Ask any value investor or speculator who relies on fundamentals to make an investment decision what they look for to justify an investment decision and they will likely tell you that they are concerned with return on earnings (ROE), earnings, sales growth, competitive advantage in the marketplace, what cutting-edge products are leading their sales growth, how much market share they control in their respective industry, and a host of other factors that they scrutinize in order to gain an understanding of the broad landscape of an investment's potential. For the astute trader or market technician, a host of technical criteria is needed in order to understand what direction price is both moving and what direction it is likely to move toward, but technicians can fall prey to using too many technical tools and indicators that can litter a price chart like so much bad graffiti, leaving you lost as to what action to take and just as likely to make the wrong decision. |
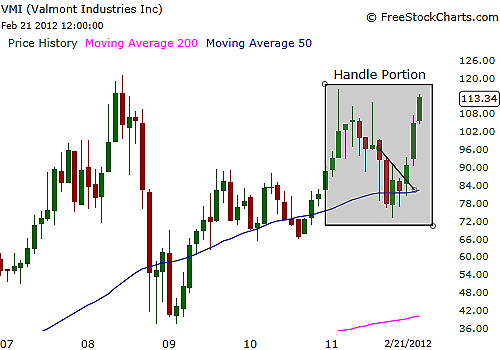
| Sadly, there is a bias toward overcomplicating anything that might resemble simplicity in the pursuit of a worthy goal such as outsized gains. Understanding that bias and being aware that it exists and subtly influences your investment decisions can give you a huge competitive advantage over less-experienced traders who are unaware that such a bias exists. To be aware that all traders have a tendency to try to make the simple complex will help you break down the essence of successful trading into its most essential parts, including how to gain a bigger picture perspective on the current state of the market and the price action in play. See Figure 1. |

|
| FIGURE 1: VMI, MONTHLY. On the monthly chart, VMI has formed a large-scale cup-with-handle pattern showing that price is set to rocket higher with this stock. |
| Graphic provided by: www.freestockcharts.com. |
| |
| In the metal fabrications industry, Valmont Industries (VMI) produces and sells fabricated metal products, pole and tower structures, and mechanized irrigation systems in the United States and internationally. It has displayed impressive fundamental criteria that should earn it a second glance from any serious trader in search of a strong bullish candidate in a market that has turned upward on higher volume. At a $3 billion market capitalization, VMI is a smaller stock but has a low stock float of just under 23 million shares and attractive low number of outstanding shares of just over 26 million. Both fundamental factors lend themselves to a stock that has good liquidity but a low supply of stocks that could easily run up in value as investors hungry for its stock could bid up the stock's price quickly, an added advantage for an astute trader. |

|
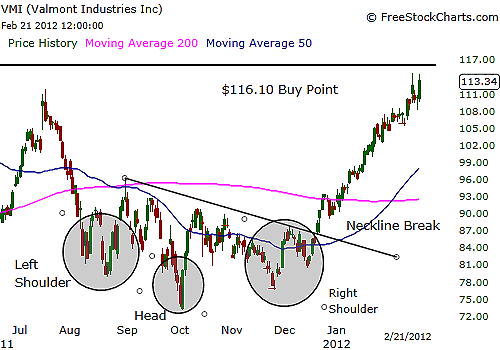
| FIGURE 2: VMI. Within the handle portion of the pattern, VMI formed an inverse head & shoulders pattern where price then broke the pattern's neckline and headed higher. Just overhead, the $116.20 buy point lies in waiting for a long entry to be triggered and a potential home run trade lies dormant until then. |
| Graphic provided by: www.freestockcharts.com. |
| |
| Adding to that, its strong earnings growth year over year, rising sales revenue, strong demand for its goods and services in its marketplace, and strong return on assets, VMI is a stock that could go places if its technical criteria match its rosy fundamentals. On the technical side, the daily chart (Figure 2) tells you that VMI has had a recent inverse head & shoulders pattern that is a bottoming pattern, signifying that price has a foothold to rise from its price lows, which VMI promptly did when it broke the neckline at the $87 level. Price then promptly entered a strong period of contraction to the upside with price targets of $112, surpassing it and approaching its all-time high. While price seems to have surged higher, it would be foolish to try to chase it, but a juicier trade may be in the making. |
| Since you know it's smart to chase a trade that is under way, it is vital that you start to look at the stock from different angles, or, in this case, different time periods, in order to see if there is any compelling technical criteria to justify a potential future trade. By scrolling up to the monthly charts, you can determine that there is a cup-with-handle pattern forming with current price action trading within the handle portion of the pattern. As the stock approaches a $116.20 buy point, VMI may be a potential home run as the bigger-picture perspective on its technical data, because you knew to look at the bigger picture rather than just scroll to a new price chart. |
Billy Williams has been trading the markets for 27 years, specializing in momentum trading with stocks and options.
| Company: | StockOptionSystem.com |
| E-mail address: | stockoptionsystem.com@gmail.com |
Traders' Resource Links | |
| StockOptionSystem.com has not added any product or service information to TRADERS' RESOURCE. | |
Click here for more information about our publications!
PRINT THIS ARTICLE

Request Information From Our Sponsors
- StockCharts.com, Inc.
- Candle Patterns
- Candlestick Charting Explained
- Intermarket Technical Analysis
- John Murphy on Chart Analysis
- John Murphy's Chart Pattern Recognition
- John Murphy's Market Message
- MurphyExplainsMarketAnalysis-Intermarket Analysis
- MurphyExplainsMarketAnalysis-Visual Analysis
- StockCharts.com
- Technical Analysis of the Financial Markets
- The Visual Investor
- VectorVest, Inc.
- Executive Premier Workshop
- One-Day Options Course
- OptionsPro
- Retirement Income Workshop
- Sure-Fire Trading Systems (VectorVest, Inc.)
- Trading as a Business Workshop
- VectorVest 7 EOD
- VectorVest 7 RealTime/IntraDay
- VectorVest AutoTester
- VectorVest Educational Services
- VectorVest OnLine
- VectorVest Options Analyzer
- VectorVest ProGraphics v6.0
- VectorVest ProTrader 7
- VectorVest RealTime Derby Tool
- VectorVest Simulator
- VectorVest Variator
- VectorVest Watchdog
