HOT TOPICS LIST
- MACD
- Fibonacci
- RSI
- Gann
- ADXR
- Stochastics
- Volume
- Triangles
- Futures
- Cycles
- Volatility
- ZIGZAG
- MESA
- Retracement
- Aroon
INDICATORS LIST
LIST OF TOPICS
PRINT THIS ARTICLE
by Donald W. Pendergast, Jr.
Even though they're up by more than 60% since late November 2011, shares of Western Digital appear ready to make another attempt at a new 52-week high.
Position: N/A
Donald W. Pendergast, Jr.
Donald W. Pendergast is a financial markets consultant who offers specialized services to stock brokers and high net worth individuals who seek a better bottom line for their portfolios.
PRINT THIS ARTICLE
TRADING SYSTEMS
For Western Digital, Another Attempt At A 52-Week High?
02/24/12 11:29:56 AMby Donald W. Pendergast, Jr.
Even though they're up by more than 60% since late November 2011, shares of Western Digital appear ready to make another attempt at a new 52-week high.
Position: N/A
| Have you ever looked at a price chart of a stock or commodity market that has made a very strong trending move and wondered when it was finally going to pull back, and as soon as you do so, you realize that it's not pulling back but is instead trending higher? I suspect a lot of traders were thinking exactly that about the Standard & Poor's 500 over the past couple of weeks, and it is actually moving higher again, almost as though it were immune to the laws of gravity. A similar situation now is manifesting on Western Digital's (WDC) daily chart, and that's where we will spend some quality time right now. See Figures 1 and 2. |

|
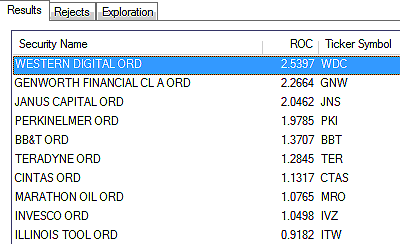
| FIGURE 1: RELATIVE STRENGTH. Here are the top relative strength (versus the .SPX over the last 13 weeks) large-cap stocks issuing RMO swing buy signals for February 16, 2012. |
| Graphic provided by: MetaStock. |
| Graphic provided by: MetaStock Explorer. |
| |
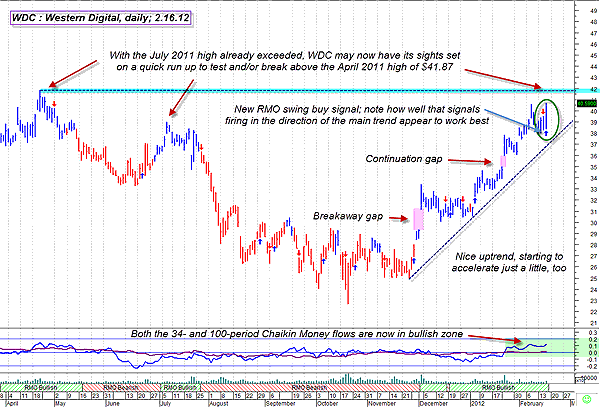
| Many individually bullish facets come together on this daily chart, and it does appear that WDC has a very high probability of at least meeting -- if not exceeding -- the April 2011 swing high price of $41.87 sometime soon. If you look toward the lower portion of the current upswing (since late November 2011), you'll note the initial breakaway gap and the pronounced continuation gap (both shaded in pink), the first one coming right after Thanksgiving and the following one arriving in mid-January 2012. Whenever you see two substantial gaps like that in series (bullish breakaway and the continuation), it's very common for there to be at least one more significant thrust higher, with the move possibly signaling its intention to reverse lower soon after a final or exhaustion gap prints on the chart. So far, there is no sign of the exhaustion gap, and in fact the entire uptrend is accelerating slightly as it inches closer to the major resistance at $41.87. Meanwhile, both the short- and long-term Chaikin money flow indicators (the CMF [34] and CMF [100], respectively) are now in the bullish zone -- above their zero lines -- and the stock also has the highest 13-week comparative relative strength ranking versus the .SPX of all large-cap stocks firing RMO swing buy signals on Thursday. |

|
| FIGURE 2: WDC, DAILY. Overall, it looks likely that WDC will meet or even exceed its key resistance price of $41.87 within the next few trading sessions. A clean exhaustion gap could be a precursor to a stallout or even reversal of the current powerful trend, however. |
| Graphic provided by: MetaStock. |
| Graphic provided by: RMO trading system indicators from MetaStock 11. |
| |
| Overall, this is a pure breakout/momentum setup that is sure to attract any number of intraday swing traders and maybe a few covered-call players, too. Regardless of how you choose to trade WDC from the long side, be aware that there is almost certain to be some turbulence at that $41.87 area, so be prepared for whatever this stock may throw back at you if you are long at that resistance area. In addition, if the stock does bust above $41.87, followed by an exhaustion gap, and you're not already in a position, by all means wait for some kind of pullback and test of $41.87 from the top side before considering putting on a brand-new long position in WDC. Support and resistance are important technical concepts to understand, especially if you want to survive as a trader. Study WDC's price action on different time frames should it soon run higher to that key resistance level, and pay attention to all of the information the stock may be telegraphing to you. It will most likely be time well spent, especially if you are still learning about the importance of the concept of support and resistance. |
Donald W. Pendergast is a financial markets consultant who offers specialized services to stock brokers and high net worth individuals who seek a better bottom line for their portfolios.
| Title: | Writer, market consultant |
| Company: | Linear Trading Systems LLC |
| Jacksonville, FL 32217 | |
| Phone # for sales: | 904-239-9564 |
| E-mail address: | lineartradingsys@gmail.com |
Traders' Resource Links | |
| Linear Trading Systems LLC has not added any product or service information to TRADERS' RESOURCE. | |
Click here for more information about our publications!
PRINT THIS ARTICLE

Request Information From Our Sponsors
- StockCharts.com, Inc.
- Candle Patterns
- Candlestick Charting Explained
- Intermarket Technical Analysis
- John Murphy on Chart Analysis
- John Murphy's Chart Pattern Recognition
- John Murphy's Market Message
- MurphyExplainsMarketAnalysis-Intermarket Analysis
- MurphyExplainsMarketAnalysis-Visual Analysis
- StockCharts.com
- Technical Analysis of the Financial Markets
- The Visual Investor
- VectorVest, Inc.
- Executive Premier Workshop
- One-Day Options Course
- OptionsPro
- Retirement Income Workshop
- Sure-Fire Trading Systems (VectorVest, Inc.)
- Trading as a Business Workshop
- VectorVest 7 EOD
- VectorVest 7 RealTime/IntraDay
- VectorVest AutoTester
- VectorVest Educational Services
- VectorVest OnLine
- VectorVest Options Analyzer
- VectorVest ProGraphics v6.0
- VectorVest ProTrader 7
- VectorVest RealTime Derby Tool
- VectorVest Simulator
- VectorVest Variator
- VectorVest Watchdog
