HOT TOPICS LIST
- MACD
- Fibonacci
- RSI
- Gann
- ADXR
- Stochastics
- Volume
- Triangles
- Futures
- Cycles
- Volatility
- ZIGZAG
- MESA
- Retracement
- Aroon
INDICATORS LIST
LIST OF TOPICS
PRINT THIS ARTICLE
by Chaitali Mohile
GGC is ready to initiate a fresh bullish rally.
Position: Buy
Chaitali Mohile
Active trader in the Indian stock markets since 2003 and a full-time writer. Trading is largely based upon technical analysis.
PRINT THIS ARTICLE
CHART ANALYSIS
GGC Shows Strong Buying Signal
02/23/12 09:52:57 AMby Chaitali Mohile
GGC is ready to initiate a fresh bullish rally.
Position: Buy
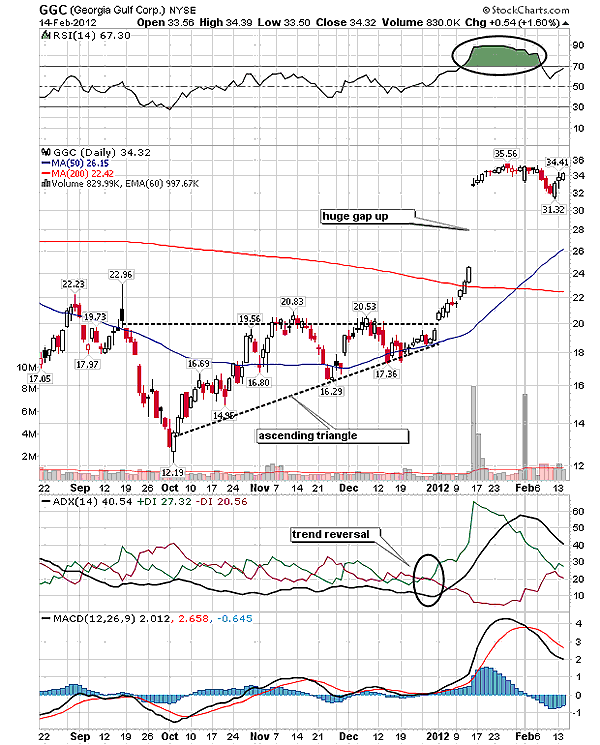
| Georgia Gulf Corp. (GGC) was engulfed by a weak trend for about four to five months. During this period, GGC remained under robust bearish pressure of the 200-day moving average (MA) resistance. The stock consolidated due to the weak trend and the MA resistance. However, the range-bound rally formed an ascending triangle -- a bullish trend reversal formation as can be seen in Figure 1. Notice the start of a bullish trend following the formation of the ascending triangle. In Figure 1, the weak trend was reversed and a new uptrend was initiated. The ascending triangle broke upward, beginning a fresh upward rally and also developed strong buying pressure in the rally. As a result, the average directional index (ADX) (14) developed an uptrend. A breakout journey violated the robust 200-day MA resistance and immediately witnessed a huge gap up. |

|
| FIGURE 1: GGC, DAILY |
| Graphic provided by: StockCharts.com. |
| |
| The gap up pulled the relative strength index (RSI) (14) into overbought territory above 70 levels. The other two indicators, the ADX (14) and the moving average convergence/divergence (MACD) (12,26,9), turned extremely bullish as well, triggering a reversal possibility. Thereafter, GGC underwent a volatile sideways consolidation but sustained its bullishness. Technically, gaps can be traded successfully either after the consolidation or after the gap refilling. Currently, the stock is getting ready to resume its bullish journey. After surging above 35 levels, traders can trigger their long positions for GGC. |
| After plunging a few points from 90 levels, the RSI (14) has stabilized in an overbought region. An overheated ADX (14) has slipped to 40 levels, and the positive MACD (14) has also tumbled a few points from the top. Thus, all three indicators have sustained the bullish levels, showing potential strength in the new bullish rally. Traders can consider these indications for the best buying opportunities. |

|
| FIGURE 2: GGC, MONTHLY |
| Graphic provided by: StockCharts.com. |
| |
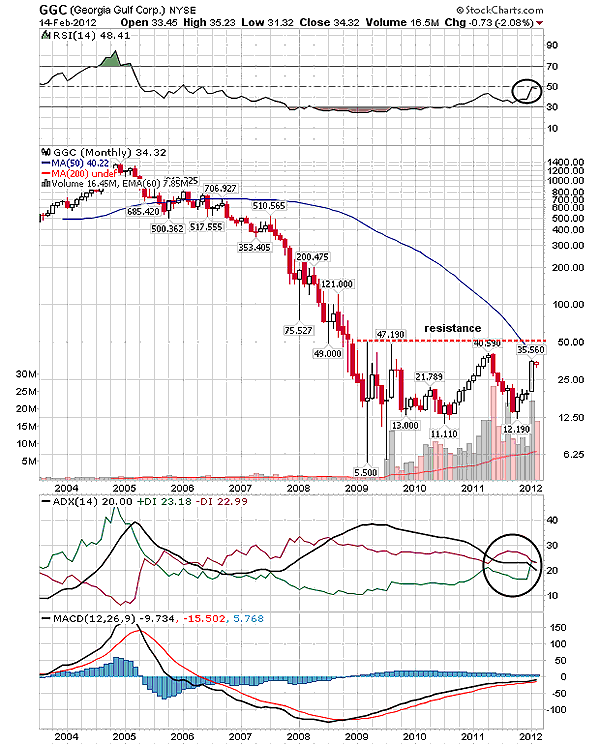
| Let us now look at the monthly chart in Figure 2 to identifying the estimated target for GGC. Over the years, the stock was in a robust downtrend; however, it is now forming a bottom. The downtrend weakened in 2011; therefore, the bearish pressure should diminish in the long run. The bottom formation is a bullish trend reversal formation that starts a fresh upward price action. Once GGC accumulates sufficient bullish strength, a new uptrend should develop and the bottom should form completely. Thereafter, a bullish breakout above the 50 levels in Figure 2 would witness strong support. We can see that the bottom is in a wide range. |
| The upper range of the formation that is 47 levels and the descending 50-day moving average would be the two resistances for the forthcoming bullish rally. The ADX (14) shows a developing downtrend, the RSI (14) is fluctuating near the 50 levels, and the gap between the trigger line and MACD line is narrow, reflecting weak momentum. Therefore, GGC is likely to face high bearish pressure during the current rally. The ongoing price action is a part of bottom formation. In such a situation, breaching the resistance would be difficult for the stock, so we can consider $40 as our immediate target. The short-term traders can enter long positions above 35 levels and look to grab a profit of about $5. GGC would become more attractive above 50 levels for all types of traders and investors. |
Active trader in the Indian stock markets since 2003 and a full-time writer. Trading is largely based upon technical analysis.
| Company: | Independent |
| Address: | C1/3 Parth Indraprasth Towers. Vastrapur |
| Ahmedabad, Guj 380015 | |
| E-mail address: | chaitalimohile@yahoo.co.in |
Traders' Resource Links | |
| Independent has not added any product or service information to TRADERS' RESOURCE. | |
Click here for more information about our publications!
PRINT THIS ARTICLE

Request Information From Our Sponsors
- StockCharts.com, Inc.
- Candle Patterns
- Candlestick Charting Explained
- Intermarket Technical Analysis
- John Murphy on Chart Analysis
- John Murphy's Chart Pattern Recognition
- John Murphy's Market Message
- MurphyExplainsMarketAnalysis-Intermarket Analysis
- MurphyExplainsMarketAnalysis-Visual Analysis
- StockCharts.com
- Technical Analysis of the Financial Markets
- The Visual Investor
- VectorVest, Inc.
- Executive Premier Workshop
- One-Day Options Course
- OptionsPro
- Retirement Income Workshop
- Sure-Fire Trading Systems (VectorVest, Inc.)
- Trading as a Business Workshop
- VectorVest 7 EOD
- VectorVest 7 RealTime/IntraDay
- VectorVest AutoTester
- VectorVest Educational Services
- VectorVest OnLine
- VectorVest Options Analyzer
- VectorVest ProGraphics v6.0
- VectorVest ProTrader 7
- VectorVest RealTime Derby Tool
- VectorVest Simulator
- VectorVest Variator
- VectorVest Watchdog
