HOT TOPICS LIST
- MACD
- Fibonacci
- RSI
- Gann
- ADXR
- Stochastics
- Volume
- Triangles
- Futures
- Cycles
- Volatility
- ZIGZAG
- MESA
- Retracement
- Aroon
INDICATORS LIST
LIST OF TOPICS
PRINT THIS ARTICLE
by Donald W. Pendergast, Jr.
Shares of the Australian dollar ETF have been substantially outperforming the US Dollar Index over the past calendar quarter, but that relationship may be about to change.
Position: N/A
Donald W. Pendergast, Jr.
Donald W. Pendergast is a financial markets consultant who offers specialized services to stock brokers and high net worth individuals who seek a better bottom line for their portfolios.
PRINT THIS ARTICLE
REL. STR COMPARATIVE
Australian Dollar ETF Outperforming USD Index
02/23/12 08:37:02 AMby Donald W. Pendergast, Jr.
Shares of the Australian dollar ETF have been substantially outperforming the US Dollar Index over the past calendar quarter, but that relationship may be about to change.
Position: N/A
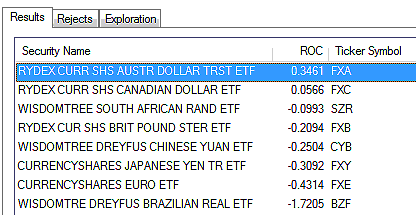
| For those who hate the idea of trading currencies on margin and who would just prefer to trade stocks or exchange traded funds (ETFs) on a cash basis, there are no shortage of currency ETFs from which to choose. For the last calendar quarter (13 weeks), the Australian Dollar (FXA) ETF has been doing quite well against the US Dollar Index (.DXY), and in fact, it just completed a very nice 6% uptrending move from late December 2011. But the good times hailing from the Land Down Under may be about over, and the .DXY appears to be ready to rise once again after a proportional pullback in the midst of a five-and-a-half-month old uptrend. Here's a closer look now (Figures 1, 2, and 3). |

|
| FIGURE 1: RELATIVE STRENGTH. The 13-week relative strength ranking of eight currency ETFs vs. the US Dollar Index (.DXY). |
| Graphic provided by: MetaStock. |
| Graphic provided by: MetaStock Explorer. |
| |
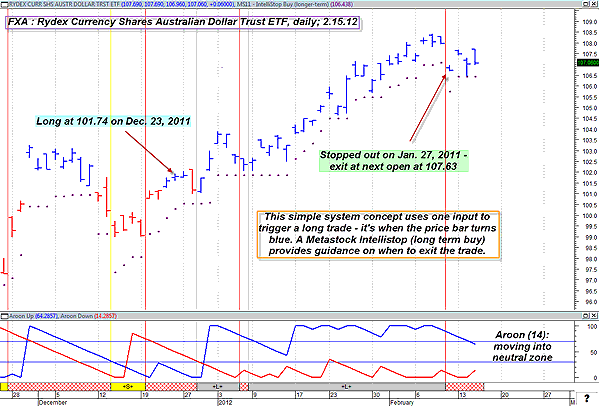
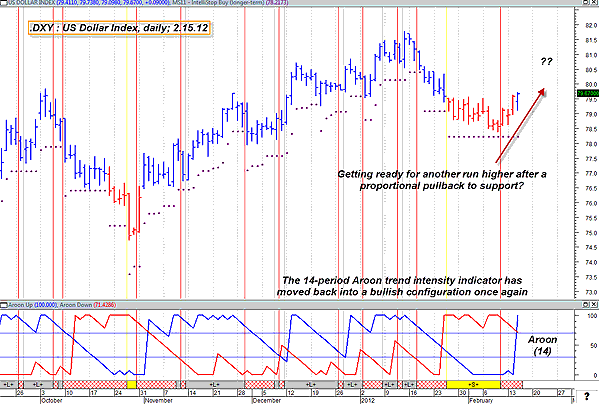
| Since the CS Hybrid expert advisor (from MetaStock 11) printed a blue (bullish bias) daily price bar on FXA's chart on December 21, 2011, the ETF has seen only one red price bar print during the past seven weeks, with the ETF making a nice bullish run higher until early February 2012. You can see how well the MetaStock long-term buy Intellistop (a standard trailing-stop indicator in MetaStock) would have helped keep a bullish trader positioned in the stock, making the most out of this powerful and steady trending move. More recently, however, note how the 14-period Aroon indicator has begun to fall into a more neutral zone, perhaps signifying the onset of a consolidation or even a trend reversal. At the same time that FXA is starting to exhibit signs of weakness, the US Dollar Index has just received the blessing of its very own blue price bar from the CS Scientific advisor even as the 14-period Aroon indicator has just moved back into the bullish zone. A daily break and close above 79.7380 may just be the start of another swing higher in this closely watched currency benchmark. The Intellistop is currently at a reading of 78.2173, so be sure to calculate your account risk accordingly if planning to follow through on this long entry setup. |

|
| FIGURE 2: AUSTRALIAN DOLLAR TRUST ETF, DAILY. Is the Australian dollar ETF going into a consolidation phase before another run higher (or lower), or is a major trend reversal already in the works? |
| Graphic provided by: MetaStock. |
| Graphic provided by: CS Scientific Expert from MetaStock 11. |
| |
| As far as some of the other currency ETFs are concerned, note how three of the other major currencies are faring against the .DXY; the British pound (FXB), the yen (FXY), and the euro (FXE) are all significantly underperforming the US Dollar Index, as are the Chinese yuan (CYB), Brazilian real (BZF), and South African rand (SZR). If you trade currencies, it's always a good idea to determine which set of foreign currencies are outperforming the currency in the nation where you live and do business in. As you do, see which currencies are strengthening and which ones are weakening; you may find yourself equipped with the extra market edge you need to profit in the currency-related markets. |

|
| FIGURE 3: US DOLLAR INDEX, DAILY. Buying a breakout after a smooth pullback into a strong Fibonacci retracement zone (in this case, the 50% Fib support of the prior uptrend) makes a lot more sense than trying to buy in after a major-shock selloff. The US Dollar Index has been in an uptrend since late August 2011. |
| Graphic provided by: MetaStock. |
| Graphic provided by: CS Scientific Expert from MetaStock 11. |
| |
Donald W. Pendergast is a financial markets consultant who offers specialized services to stock brokers and high net worth individuals who seek a better bottom line for their portfolios.
| Title: | Writer, market consultant |
| Company: | Linear Trading Systems LLC |
| Jacksonville, FL 32217 | |
| Phone # for sales: | 904-239-9564 |
| E-mail address: | lineartradingsys@gmail.com |
Traders' Resource Links | |
| Linear Trading Systems LLC has not added any product or service information to TRADERS' RESOURCE. | |
Click here for more information about our publications!
PRINT THIS ARTICLE

Request Information From Our Sponsors
- StockCharts.com, Inc.
- Candle Patterns
- Candlestick Charting Explained
- Intermarket Technical Analysis
- John Murphy on Chart Analysis
- John Murphy's Chart Pattern Recognition
- John Murphy's Market Message
- MurphyExplainsMarketAnalysis-Intermarket Analysis
- MurphyExplainsMarketAnalysis-Visual Analysis
- StockCharts.com
- Technical Analysis of the Financial Markets
- The Visual Investor
- VectorVest, Inc.
- Executive Premier Workshop
- One-Day Options Course
- OptionsPro
- Retirement Income Workshop
- Sure-Fire Trading Systems (VectorVest, Inc.)
- Trading as a Business Workshop
- VectorVest 7 EOD
- VectorVest 7 RealTime/IntraDay
- VectorVest AutoTester
- VectorVest Educational Services
- VectorVest OnLine
- VectorVest Options Analyzer
- VectorVest ProGraphics v6.0
- VectorVest ProTrader 7
- VectorVest RealTime Derby Tool
- VectorVest Simulator
- VectorVest Variator
- VectorVest Watchdog
