HOT TOPICS LIST
- MACD
- Fibonacci
- RSI
- Gann
- ADXR
- Stochastics
- Volume
- Triangles
- Futures
- Cycles
- Volatility
- ZIGZAG
- MESA
- Retracement
- Aroon
INDICATORS LIST
LIST OF TOPICS
PRINT THIS ARTICLE
by Matt Blackman
In my January 10th article when the stock was trading around $86 ("Is The Worst Finally Over For Netflix?"), I presented an argument about why it might be time to buy the stock. Now with the stock and market looking a little toppy, it may be time to consider taking some profits off the table.
Position: N/A
Matt Blackman
Matt Blackman is a full-time technical and financial writer and trader. He produces corporate and financial newsletters, and assists clients in getting published in the mainstream media. He is the host of TradeSystemGuru.com. Matt has earned the Chartered Market Technician (CMT) designation. Find out what stocks and futures Matt is watching on Twitter at www.twitter.com/RatioTrade
PRINT THIS ARTICLE
DETREND PRICE OSCILL
Time For A NetFlix Pit Stop?
02/22/12 09:11:58 AMby Matt Blackman
In my January 10th article when the stock was trading around $86 ("Is The Worst Finally Over For Netflix?"), I presented an argument about why it might be time to buy the stock. Now with the stock and market looking a little toppy, it may be time to consider taking some profits off the table.
Position: N/A
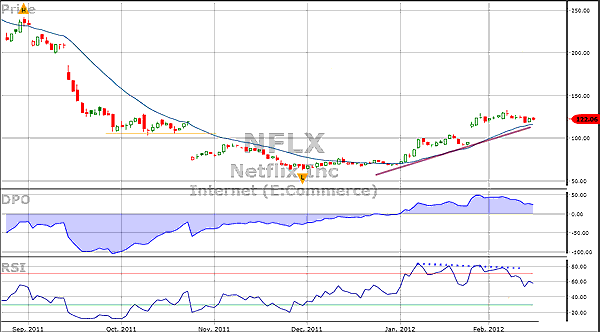
| NetFlix (NFLX), the stock many analysts love to hate, has been volatile of late. After peaking last July above $300, it got hammered, dropping nearly 80% in the process. And now that NFLX is up more than 90% off its November bottom, there are signs that it is in need of a rest. As we can see in Figure 1, the stock over the last six months has been bottoming, and now there are signs of diminishing momentum confirmed by both detrended price oscillator (DPO) and relative strength index (RSI) and indications that the stock is in overbought territory. Also note that the blue 30-period weighted moving average and purple uptrend line are getting close to being broken. For those who use these indicators, a sell would be triggered if one or both events were to occur, depending on your individual trading rules. |
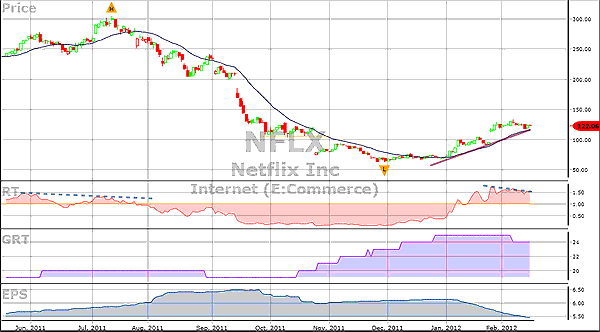
| In Figure 2, we take a longer-term fundamental look at the stock. It is interesting to note that Vector Vest generated a confirmed buy call on NFLX back on January 3 when the stock was trading around $72 based on the fact that the relative timing indicator moved past 1, indicating a confirmed change in trend (see red RT histogram in Figure 2). |

|
| FIGURE 1: NFLX, DAILY. Here's a daily chart of NFLX showing the technical take for the stock. The RSI is indicating a sell on this chart, as it has fallen below the horizontal 70 line (red). |
| Graphic provided by: VectorVest.com. |
| |
| But as we see in Figure 2, relative timing (RT), earnings growth (GRT), or forecasted earnings per share (EPS) are issuing confirmed sell signals just yet. However, if all three continue to deteriorate, this picture could change quickly. As mentioned previously, waiting for fundamental indicators (such as earnings growth or earnings per share) to tell you when to get out is not usually a good idea, since price generally moves well ahead of the fundamentals. It's better to exit when the technicals say to sell. |

|
| FIGURE 2: NFLX, DAILY. This chart shows the fundamentals for Netflix with confirmed negative divergence in all three indicators in the lower subgraphs. No official sell signal is noted yet, but momentum is clearly dissipating. |
| Graphic provided by: VectorVest.com. |
| |
| Traders often ignore the fundamentals at their peril. Even though they lag stock prices, it is important for the technically trained to know what the herd is doing, a group that is traditionally fundamentally driven. A close eye on the fundamentals can often provide us with valuable advance warning that analysts may be getting ready to downgrade a stock based on deteriorating fundamentals, even though the stock chart may have been broadcasting this for days or even weeks. |
| As one well-known trader once said, trading is all about using whatever works, implying that a blinkered focus on pure technicals results in missing the big, more information-packed picture. |
Matt Blackman is a full-time technical and financial writer and trader. He produces corporate and financial newsletters, and assists clients in getting published in the mainstream media. He is the host of TradeSystemGuru.com. Matt has earned the Chartered Market Technician (CMT) designation. Find out what stocks and futures Matt is watching on Twitter at www.twitter.com/RatioTrade
| Company: | TradeSystemGuru.com |
| Address: | Box 2589 |
| Garibaldi Highlands, BC Canada | |
| Phone # for sales: | 604-898-9069 |
| Fax: | 604-898-9069 |
| Website: | www.tradesystemguru.com |
| E-mail address: | indextradermb@gmail.com |
Traders' Resource Links | |
| TradeSystemGuru.com has not added any product or service information to TRADERS' RESOURCE. | |
Click here for more information about our publications!
PRINT THIS ARTICLE

|

Request Information From Our Sponsors
- StockCharts.com, Inc.
- Candle Patterns
- Candlestick Charting Explained
- Intermarket Technical Analysis
- John Murphy on Chart Analysis
- John Murphy's Chart Pattern Recognition
- John Murphy's Market Message
- MurphyExplainsMarketAnalysis-Intermarket Analysis
- MurphyExplainsMarketAnalysis-Visual Analysis
- StockCharts.com
- Technical Analysis of the Financial Markets
- The Visual Investor
- VectorVest, Inc.
- Executive Premier Workshop
- One-Day Options Course
- OptionsPro
- Retirement Income Workshop
- Sure-Fire Trading Systems (VectorVest, Inc.)
- Trading as a Business Workshop
- VectorVest 7 EOD
- VectorVest 7 RealTime/IntraDay
- VectorVest AutoTester
- VectorVest Educational Services
- VectorVest OnLine
- VectorVest Options Analyzer
- VectorVest ProGraphics v6.0
- VectorVest ProTrader 7
- VectorVest RealTime Derby Tool
- VectorVest Simulator
- VectorVest Variator
- VectorVest Watchdog
