HOT TOPICS LIST
- MACD
- Fibonacci
- RSI
- Gann
- ADXR
- Stochastics
- Volume
- Triangles
- Futures
- Cycles
- Volatility
- ZIGZAG
- MESA
- Retracement
- Aroon
INDICATORS LIST
LIST OF TOPICS
PRINT THIS ARTICLE
by Koos van der Merwe
Is the share price building a shoulder of an inverse head & shoulder formation?
Position: Buy
Koos van der Merwe
Has been a technical analyst since 1969, and has worked as a futures and options trader with First Financial Futures in Johannesburg, South Africa.
PRINT THIS ARTICLE
HEAD & SHOULDERS
Thomson Reuters Inverse?
02/21/12 09:34:39 AMby Koos van der Merwe
Is the share price building a shoulder of an inverse head & shoulder formation?
Position: Buy
| On February 9, Thomson Reuters (TRIX), listed on the Toronto Stock Exchange, boosted its annual dividend by four cents as it reported its earnings, the 19th consecutive annual increase to its payout to investors. |

|
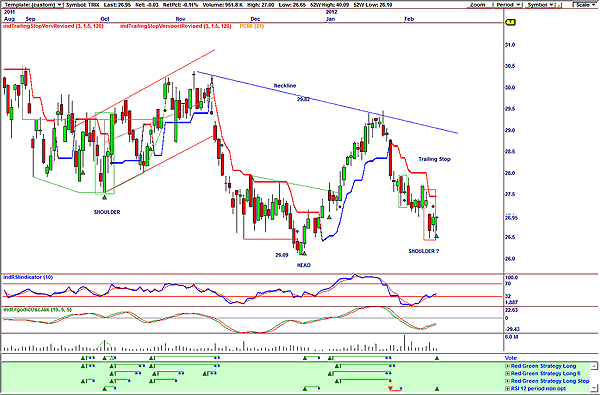
| FIGURE 1: INVERSE HEAD & SHOULDERS. Here's a suggestion of an inverse head & shoulders; a buy signal is given. |
| Graphic provided by: OmniTrader. |
| |
| The OmniTrader program (Figure 1) has given me a buy signal using the red green voting strategy, plus a 12-period relative strength index (RSI) strategy. My chart shows the buy signal given on the vote line. This buy signal does suggest the possible formation of an inverse head & shoulders as shown. Should this pattern truly form, the target will be $33.55 (29.82 - 26.09 = 3.73 + 29.82 = 33.55). However, the price would have to break above the neckline in the region of the $28 level for the pattern to be confirmed. The share price is still below the trailing stop indicator shown on the chart. A move above this stop could confirm the buy signal given by the vote line. Do note that the 10-period RSI has given a buy signal, as has the ergodic oscillator. All three buy signals suggest a strong move up of almost a cent. |

|
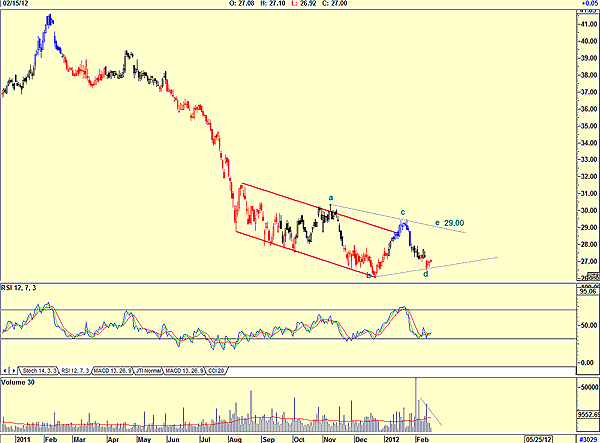
| FIGURE 2: TRIX. A possible symmetrical triangle suggests a reverse in direction. |
| Graphic provided by: AdvancedGET. |
| |
| Figure 2 suggests the formation of a symmetrical triangle, and not an inverse head & shoulders pattern. A symmetrical triangle, sometimes known as a "coil," can suggest the reversal of a trend, but they usually act as a period of consolidation because of indecision on the part of buyers and sellers. Note how volume has fallen as the price fell, usually a sign of strength. Because the points of a triangle usually move in an a-b-c-d-e pattern, the trend should therefore be up to test the upper resistance line at $29.00. Should this occur on rising volume, it will be a sign of strength and possibly confirm the formation of the inverse head & shoulders pattern of Figure 1. I have drawn downtrend lines in red. Price has broken the upper red resistance line, suggesting that the triangle pattern could be real. Whether the pattern forming is an inverse head & shoulders, or simply a symmetrical triangle suggesting indecision, is something only the future will confirm. However, the fact the RSI has given a buy signal is a strong suggestion that the share price will move up. How high it will move, however, is in question. |
Has been a technical analyst since 1969, and has worked as a futures and options trader with First Financial Futures in Johannesburg, South Africa.
| Address: | 3256 West 24th Ave |
| Vancouver, BC | |
| Phone # for sales: | 6042634214 |
| E-mail address: | petroosp@gmail.com |
Click here for more information about our publications!
PRINT THIS ARTICLE

Request Information From Our Sponsors
- StockCharts.com, Inc.
- Candle Patterns
- Candlestick Charting Explained
- Intermarket Technical Analysis
- John Murphy on Chart Analysis
- John Murphy's Chart Pattern Recognition
- John Murphy's Market Message
- MurphyExplainsMarketAnalysis-Intermarket Analysis
- MurphyExplainsMarketAnalysis-Visual Analysis
- StockCharts.com
- Technical Analysis of the Financial Markets
- The Visual Investor
- VectorVest, Inc.
- Executive Premier Workshop
- One-Day Options Course
- OptionsPro
- Retirement Income Workshop
- Sure-Fire Trading Systems (VectorVest, Inc.)
- Trading as a Business Workshop
- VectorVest 7 EOD
- VectorVest 7 RealTime/IntraDay
- VectorVest AutoTester
- VectorVest Educational Services
- VectorVest OnLine
- VectorVest Options Analyzer
- VectorVest ProGraphics v6.0
- VectorVest ProTrader 7
- VectorVest RealTime Derby Tool
- VectorVest Simulator
- VectorVest Variator
- VectorVest Watchdog
