HOT TOPICS LIST
- MACD
- Fibonacci
- RSI
- Gann
- ADXR
- Stochastics
- Volume
- Triangles
- Futures
- Cycles
- Volatility
- ZIGZAG
- MESA
- Retracement
- Aroon
INDICATORS LIST
LIST OF TOPICS
PRINT THIS ARTICLE
by Donald W. Pendergast, Jr.
Trading a system in purely mechanical mode suits some traders just fine, but there are still plenty of traders who want to rely on other technical tools in order to select what they believe to be higher-probability setups. Here's a look at an attractive long buy setup in Johnson Controls.
Position: N/A
Donald W. Pendergast, Jr.
Donald W. Pendergast is a financial markets consultant who offers specialized services to stock brokers and high net worth individuals who seek a better bottom line for their portfolios.
PRINT THIS ARTICLE
TRADING SYSTEMS
Johnson Controls Ready To Rise?
02/21/12 09:30:47 AMby Donald W. Pendergast, Jr.
Trading a system in purely mechanical mode suits some traders just fine, but there are still plenty of traders who want to rely on other technical tools in order to select what they believe to be higher-probability setups. Here's a look at an attractive long buy setup in Johnson Controls.
Position: N/A
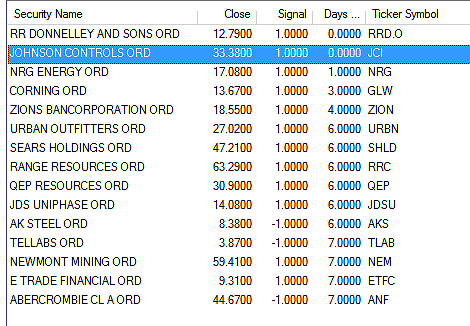
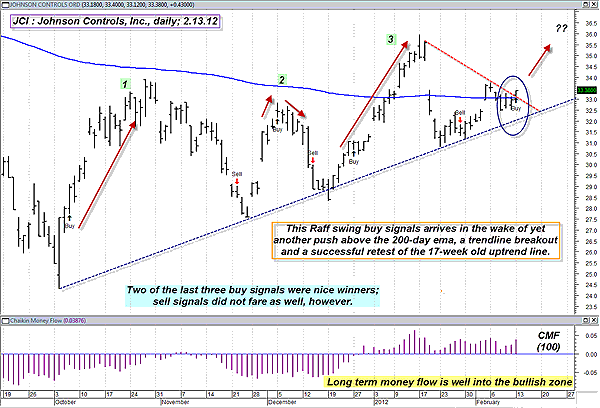
| Large-cap stocks generally don't make as dramatic kinds of swing and/or trending moves as compared to their mid- and small-cap brethren, but if you can manage to get on and then stay on the right side of a strong move in a big-cap giant, chances are you're still going to make some decent money -- most of the time. One of the better ways to do this is to use a proven trading system to generate the mechanical buy/sell signals and then add a bit of common-sense chart analysis, relative strength confirmation, and fundamental analysis to help stack the odds as heavily in the outcome of a successful trade as possible. See Figures 1 and 2. Looking at this daily chart for Johnson Controls (JCI). Note the black and red buy/sell signal arrows and note how well the recent buy signals have been working out; two were big winners and one was a minor loss. These are the expert advisor buy/sell signals for the Raff MarketSpace Stock system, one of the most useful mechanical trade systems in MetaStock 11; I find this system to be quite good, especially when the signals are confirmed by chart patterns, support/resistance tests, and money flows. In all of these regards, this new Raff buy setup in JCI receives a passing grade. Here's why: 1. Long-term money flow remains in a very bullish mode -- see the Chaikin money flow histogram at the bottom of the chart. 2. The stock recently tested the long-term uptrend line -- successfully -- which is very bullish. 3. JCI has once again made a daily close above its 200-day exponential moving average (EMA); this is the third new instance of this since the year began, another hint that big money is continuing to build a position in this stock. 4. JCI has just completed a minor breakout above the red dashed resistance line. Add the fact that the Raff system has just issued a new long entry signal, and you've got a fairly compelling reason to consider taking a shot with JCI on the long side. Now, of course, remember that the .SPX has made a very strong and steady move to the upside since late December and that there could be a minor pullback coming that could negate the attractiveness of this setup. So if you do decide to enter at a price just above Monday's high of $33.40, consider doing so with only a modest amount of capital at risk, or even better, consider scaling in to the position as it moves higher, thus limiting your losses should the market turn suddenly against you after putting on your first portion of the trade. That's how the famed turtle traders entered positions in the markets they traded, and it's a very simple and sound trading technique, particularly for long-term trend followers whose systems have a winning percentage in the 40% to 50% range. In this case, you decide that you want to put on a third of the position on a buy-stop order at $33.41, another third at $33.51, and then the final third if the price hits $33.61. You would of course place a sell-stop below the recent swing low of $32.45, no matter how many of the portions of the trade go on, gradually trailing the entire move higher (if it actually goes higher at all) with some sort of a trailing stop (a price channel stop, volatility stop, and so on) until final closeout. The advantages of scaling in are numerous: 1. If the trade immediately gets stopped out after the first portion is put on, you will only lose a third as much as those who put on a full position at the same entry price. 2. You are forcing the market to take the stock higher, making it follow through, before committing more capital to it. 3. If the move turns out to be significant, you will still make nearly as much money at the trader who went all in at the trade's inception, but will have had less stress and wear and tear on your account equity if the trade had gone south early on. |

|
| FIGURE 1: LARGE-CAP STOCKS. The large-cap stocks issuing Raff buy/sell signals during the last seven trading sessions. |
| Graphic provided by: MetaStock. |
| Graphic provided by: Metastock's Explorer. |
| |
| Consider this kind of scaling in strategy the next time you identify a potential trend-following entry setup, and you may find that you'll just keep on using it, no matter what kind of mechanical system you use to generate your entry signals. By the way, the same general principles apply for short entries, too -- for trend-following systems, that is. |

|
| FIGURE 2: JCI, DAILY. There are several key support and resistance areas on this chart. Can you identify them and understand why support & resistance is such an important technical dynamic? |
| Graphic provided by: MetaStock. |
| Graphic provided by: Raff MarketSpace Stock System from MetaStock 11. |
| |
Donald W. Pendergast is a financial markets consultant who offers specialized services to stock brokers and high net worth individuals who seek a better bottom line for their portfolios.
| Title: | Writer, market consultant |
| Company: | Linear Trading Systems LLC |
| Jacksonville, FL 32217 | |
| Phone # for sales: | 904-239-9564 |
| E-mail address: | lineartradingsys@gmail.com |
Traders' Resource Links | |
| Linear Trading Systems LLC has not added any product or service information to TRADERS' RESOURCE. | |
Click here for more information about our publications!
PRINT THIS ARTICLE

Request Information From Our Sponsors
- VectorVest, Inc.
- Executive Premier Workshop
- One-Day Options Course
- OptionsPro
- Retirement Income Workshop
- Sure-Fire Trading Systems (VectorVest, Inc.)
- Trading as a Business Workshop
- VectorVest 7 EOD
- VectorVest 7 RealTime/IntraDay
- VectorVest AutoTester
- VectorVest Educational Services
- VectorVest OnLine
- VectorVest Options Analyzer
- VectorVest ProGraphics v6.0
- VectorVest ProTrader 7
- VectorVest RealTime Derby Tool
- VectorVest Simulator
- VectorVest Variator
- VectorVest Watchdog
- StockCharts.com, Inc.
- Candle Patterns
- Candlestick Charting Explained
- Intermarket Technical Analysis
- John Murphy on Chart Analysis
- John Murphy's Chart Pattern Recognition
- John Murphy's Market Message
- MurphyExplainsMarketAnalysis-Intermarket Analysis
- MurphyExplainsMarketAnalysis-Visual Analysis
- StockCharts.com
- Technical Analysis of the Financial Markets
- The Visual Investor
