HOT TOPICS LIST
- MACD
- Fibonacci
- RSI
- Gann
- ADXR
- Stochastics
- Volume
- Triangles
- Futures
- Cycles
- Volatility
- ZIGZAG
- MESA
- Retracement
- Aroon
INDICATORS LIST
LIST OF TOPICS
PRINT THIS ARTICLE
by Koos van der Merwe
In my article about Sony of August 17, 2011, I wondered if Sony was another Apple waiting for someone with imagination and vision. Has that time come?
Position: Accumulate
Koos van der Merwe
Has been a technical analyst since 1969, and has worked as a futures and options trader with First Financial Futures in Johannesburg, South Africa.
PRINT THIS ARTICLE
MA ENVELOPES
Looking Again At Sony
02/17/12 08:20:59 AMby Koos van der Merwe
In my article about Sony of August 17, 2011, I wondered if Sony was another Apple waiting for someone with imagination and vision. Has that time come?
Position: Accumulate
| On February 1, 2012, Sony named Kazuo Hirai as president and CEO; Sir Howard Stringer, the present CEO, will become chairman of the board of directors in June 2012. Is Sony now on the way up? |

|
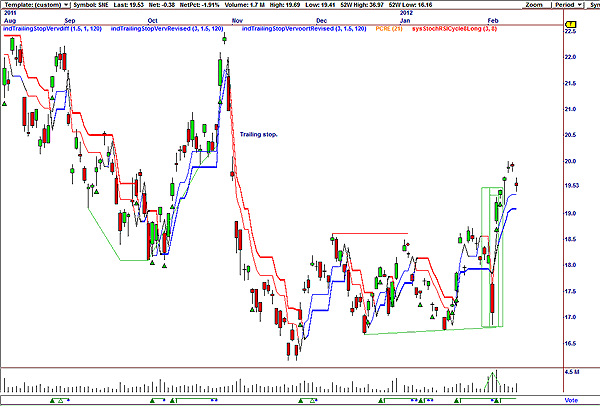
| FIGURE 1: SONY. This OmniTrader chart shows vote signals buys and trailing stop sells. |
| Graphic provided by: OmniTrader. |
| |
| Figure 1 is an OmniTrader chart and shows how Sony gave a number of buy signals at significant lows since September 2011, as share prices broke the downtrend and moved into a correction. The number of buy signals given with the sell signals as the price broke below the trailing stop does suggest uncertainty rather than a long-term hold. |

|
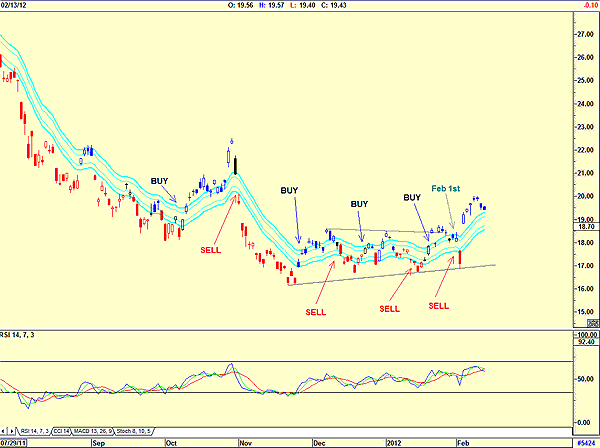
| FIGURE 2: SONY. This chart shows buy & sell signals on a JM internal band. |
| Graphic provided by: AdvancedGET. |
| |
| Figure 2 is a chart showing the JM internal band indicator, giving buy & sell signals as the price broke above the upper band line and broke below the lower band line. The JM internal band indicator is a 15-period simple moving average offset by 2% positive and 2% negative. Currently, the share price is in a buy mode. Note that on February 2, the share price dropped sharply after the announcement of the change in the company's management but immediately recovered. This obviously reflected market uncertainty. Note the relative strength index (RSI) is moving up slowly. |

|
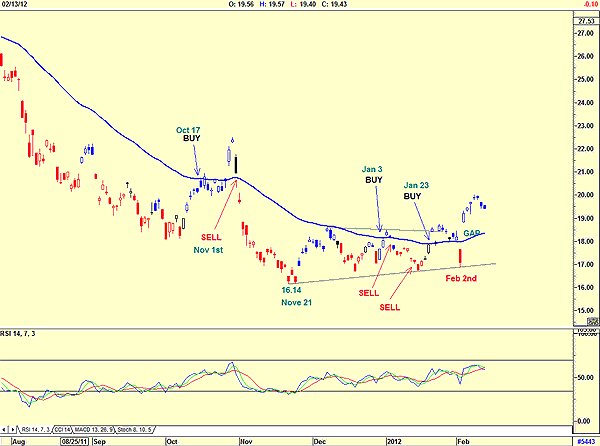
| FIGURE 3: SONY. Buy & sell signals on a 50-period moving average. |
| Graphic provided by: AdvancedGET. |
| |
| Figure 3 is for the more cautious investor. Here the investor buys companies with known management superiority, those that look to the future with imagination and that you know will not fail. The indicator that the company must cross to give you that buy signal is the 50-period moving average. Note how the price gave a buy on October 17, 2011, with a sell signal as the price broke below the 50-period moving average on a gap on November 1. It is almost as if the share price was anticipating a change in something or other within the company. The price then reached a low of $16.14 on November 21 and moved into what could be a rectangular pattern. A rectangle formation forms as a result of a battle between two groups of approximately equal strength, suggesting that those in the know of a possible management change fought against the bears. Ignoring the down move of February 2, which recovered on a wide gap on February 3 that moved back above the 50 period moving average, Sony definitely looks like a recovery buy for a long-term hold. |
Has been a technical analyst since 1969, and has worked as a futures and options trader with First Financial Futures in Johannesburg, South Africa.
| Address: | 3256 West 24th Ave |
| Vancouver, BC | |
| Phone # for sales: | 6042634214 |
| E-mail address: | petroosp@gmail.com |
Click here for more information about our publications!
PRINT THIS ARTICLE

Request Information From Our Sponsors
- StockCharts.com, Inc.
- Candle Patterns
- Candlestick Charting Explained
- Intermarket Technical Analysis
- John Murphy on Chart Analysis
- John Murphy's Chart Pattern Recognition
- John Murphy's Market Message
- MurphyExplainsMarketAnalysis-Intermarket Analysis
- MurphyExplainsMarketAnalysis-Visual Analysis
- StockCharts.com
- Technical Analysis of the Financial Markets
- The Visual Investor
- VectorVest, Inc.
- Executive Premier Workshop
- One-Day Options Course
- OptionsPro
- Retirement Income Workshop
- Sure-Fire Trading Systems (VectorVest, Inc.)
- Trading as a Business Workshop
- VectorVest 7 EOD
- VectorVest 7 RealTime/IntraDay
- VectorVest AutoTester
- VectorVest Educational Services
- VectorVest OnLine
- VectorVest Options Analyzer
- VectorVest ProGraphics v6.0
- VectorVest ProTrader 7
- VectorVest RealTime Derby Tool
- VectorVest Simulator
- VectorVest Variator
- VectorVest Watchdog
