HOT TOPICS LIST
- MACD
- Fibonacci
- RSI
- Gann
- ADXR
- Stochastics
- Volume
- Triangles
- Futures
- Cycles
- Volatility
- ZIGZAG
- MESA
- Retracement
- Aroon
INDICATORS LIST
LIST OF TOPICS
PRINT THIS ARTICLE
by James Kupfer
The US Dollar Index has retraced from its January 2012 highs and is at a low-risk entry point.
Position: Buy
James Kupfer
Mr. Kupfer is a market professional and amateur stock market commentator. Disclosure: It is likely that Mr. Kupfer has or will enter a position in any security he writes about.
PRINT THIS ARTICLE
FIBONACCI
Dollar Ready To Rally?
02/16/12 09:16:48 AMby James Kupfer
The US Dollar Index has retraced from its January 2012 highs and is at a low-risk entry point.
Position: Buy
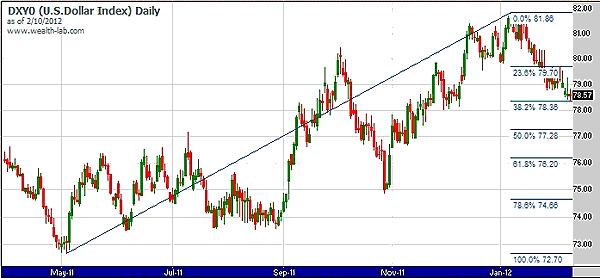
| In May 2011, the US dollar began a slow climb from the long-term downtrend it had previously been in. The dollar, as represented by the DXY0 index, bottomed around 73 in May 2011, and by January 2012 it had rallied to almost 82. From its early January peak, the dollar has retraced a significant percentage of this move and is now at an important Fibonacci resistance level. |
| As shown in Figure 1, the dollar hit the 38.2% retracement level of 78.36 on Friday. In fact, the low of the day was the exact level of support. A solitary move to any Fibonacci retracement level, however, even a major one like the 38.2% level, is not necessarily indicative of anything as price can certainly move through the support level. |

|
| FIGURE 1: US DOLLAR INDEX, DAILY |
| Graphic provided by: Weath-Lab. |
| |
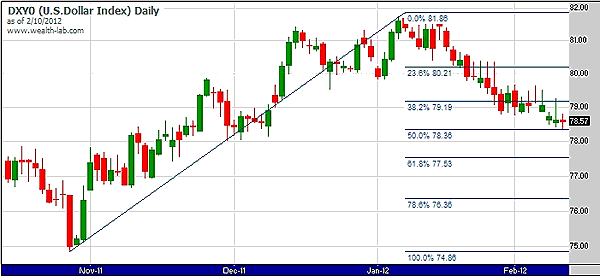
| For this reason, it can be useful to search for levels where multiple support or resistance levels coincide. The convergence of multiple Fibonacci support levels is exactly what has occurred on the dollar. With the low on Friday, the dollar has retraced exactly 50% of the move from the October 2011 bottom to the January highs. That's right, the 50% retracement of this move is 78.36, which is the same level as the May 2011 to January 2012 38.2% retracement. See Figure 2. |

|
| FIGURE 2: US DOLLAR INDEX, DAILY |
| Graphic provided by: Wealth-Lab. |
| |
| Given that two significant Fibonacci support levels coincide with where the dollar is currently at, there is a significant likelihood that the dollar will resume its climb from current levels. A long trade could be entered here using a well-defined stop that would provide meaningful upside potential with limited downside risk. |
Mr. Kupfer is a market professional and amateur stock market commentator. Disclosure: It is likely that Mr. Kupfer has or will enter a position in any security he writes about.
Click here for more information about our publications!
Comments
Date: 12/19/13Rank: 2Comment: Need more message currency ,
And currency pairs( forex)

Request Information From Our Sponsors
- StockCharts.com, Inc.
- Candle Patterns
- Candlestick Charting Explained
- Intermarket Technical Analysis
- John Murphy on Chart Analysis
- John Murphy's Chart Pattern Recognition
- John Murphy's Market Message
- MurphyExplainsMarketAnalysis-Intermarket Analysis
- MurphyExplainsMarketAnalysis-Visual Analysis
- StockCharts.com
- Technical Analysis of the Financial Markets
- The Visual Investor
- VectorVest, Inc.
- Executive Premier Workshop
- One-Day Options Course
- OptionsPro
- Retirement Income Workshop
- Sure-Fire Trading Systems (VectorVest, Inc.)
- Trading as a Business Workshop
- VectorVest 7 EOD
- VectorVest 7 RealTime/IntraDay
- VectorVest AutoTester
- VectorVest Educational Services
- VectorVest OnLine
- VectorVest Options Analyzer
- VectorVest ProGraphics v6.0
- VectorVest ProTrader 7
- VectorVest RealTime Derby Tool
- VectorVest Simulator
- VectorVest Variator
- VectorVest Watchdog
