HOT TOPICS LIST
- MACD
- Fibonacci
- RSI
- Gann
- ADXR
- Stochastics
- Volume
- Triangles
- Futures
- Cycles
- Volatility
- ZIGZAG
- MESA
- Retracement
- Aroon
INDICATORS LIST
LIST OF TOPICS
PRINT THIS ARTICLE
by Billy Williams
Price can be as crazy, but if you know how to determine who has control of price, you'll know what direction to trade in despite volatile price action.
Position: Hold
Billy Williams
Billy Williams has been trading the markets for 27 years, specializing in momentum trading with stocks and options.
PRINT THIS ARTICLE
STRATEGIES
Determining Who Has Control With Price
02/15/12 09:42:18 AMby Billy Williams
Price can be as crazy, but if you know how to determine who has control of price, you'll know what direction to trade in despite volatile price action.
Position: Hold
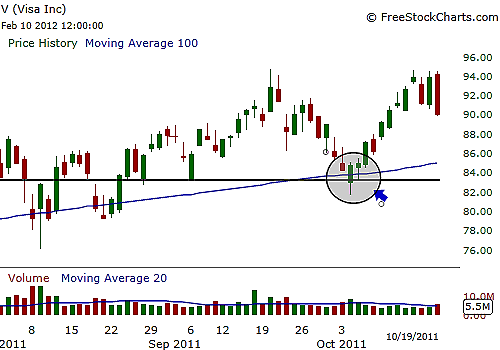
| The market does weird things at times that leave you scratching your head. The stock market looks as if it's making a comeback and then goes haywire, which would normally be funny, but it can punch you where it hurts -- your wallet. So when price goes crazy, and you've got rent money on the line, you've got to use a method that helps you understand who has control of the trend so that you navigate from the sharp peaks and valleys of a chaotic market and emerge a winner. For determining direction, it's hard to beat the old reliable 100-day simple moving average (SMA). It's not sexy, it's not flashy, but having one on your price chart will let you know at a glance where price is headed and keep you on the right side of the trend. If price is trading above the 100-day SMA and it's angled from the lower left-hand part of your screen while pointing to the upper right-hand corner, then a bullish trend is in play and that's the way to trade. See Figure 1. |

|
| FIGURE 1: V. In early October 2011, Visa tested a level of support where the bulls took back control of price the same day, while an entry was signaled two days later. |
| Graphic provided by: www.freestockcharts.com. |
| |
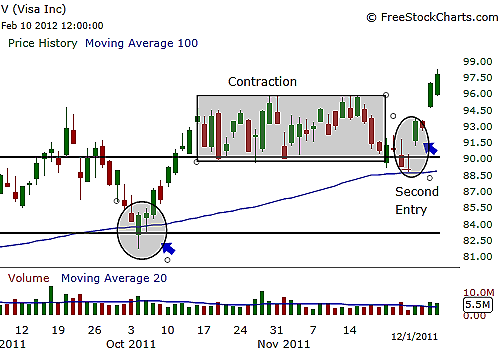
| Conversely, if the 100-day SMA is starting from the upper left-hand corner of your screen and pointing toward the right-hand corner of your screen, then a bearish trend is in play and you want to trade to the short side of the stock market. For bullish markets, look for significant price lows where price heads higher but doesn't touch that level for at least 15 to 20 trading days. If price comes back to test that level while the 100-day SMA is meeting the conditions detailed previously, then a setup condition exists. For bearish markets where the 100-day SMA is reflecting the appropriate price characteristics detailed previously as well where price has made a significant high before going lower but then retraces back to that price level to test it, then a bearish setup condition is in effect. See Figure 2. |

|
| FIGURE 2: V. As price traded upward from the initial entry, it entered a period of contraction while also forming a new level of support that was tested on November 25, 2011, but the bulls didn't take control until the following trading day by completely retracing the high and low of that price bar while simultaneously signaling an entry as well. |
| Graphic provided by: www.freestockcharts.com. |
| |
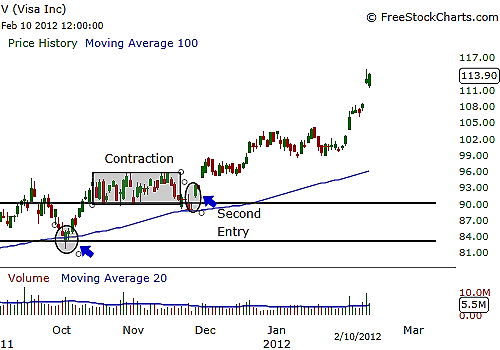
| The trigger is when price retests the high or low, depending on the context of the market at the time of the trade, and then retraces at least 55% or more back in the other direction once price closes over high/low of the price bar that has set the lowest intraday low for longs or highest intraday high for shorts. For example, in a bullish trade setup, once price retests the previous price low of not more than 15 to 20 days previously, you want to identify the price bar that has touched that level and take note of the intraday low established by the price bar. Once price retraces 55% of that bar's high and low, the bulls have control of price in the near term and you now wait for a price to close over the high of that bar and then enter a position. See Figure 3. |

|
| FIGURE 3: V. Visa has continued higher from the second entry and continues upward as of this writing. |
| Graphic provided by: www.freestockcharts.com. |
| |
| This method of the retracing price of the price bar helps determine who has control in the short term because near-term price is relatively easy to predict, whereas further out, price becomes prickly when determining where it should be. Combine this with confirming the entry with price closing strongly in the opposite direction off of established support and resistance levels with the trend filtered by the 100-day SMA, and you've got a reliable method of determining who has control and which direction to trade. |
Billy Williams has been trading the markets for 27 years, specializing in momentum trading with stocks and options.
| Company: | StockOptionSystem.com |
| E-mail address: | stockoptionsystem.com@gmail.com |
Traders' Resource Links | |
| StockOptionSystem.com has not added any product or service information to TRADERS' RESOURCE. | |
Click here for more information about our publications!
PRINT THIS ARTICLE

Request Information From Our Sponsors
- StockCharts.com, Inc.
- Candle Patterns
- Candlestick Charting Explained
- Intermarket Technical Analysis
- John Murphy on Chart Analysis
- John Murphy's Chart Pattern Recognition
- John Murphy's Market Message
- MurphyExplainsMarketAnalysis-Intermarket Analysis
- MurphyExplainsMarketAnalysis-Visual Analysis
- StockCharts.com
- Technical Analysis of the Financial Markets
- The Visual Investor
- VectorVest, Inc.
- Executive Premier Workshop
- One-Day Options Course
- OptionsPro
- Retirement Income Workshop
- Sure-Fire Trading Systems (VectorVest, Inc.)
- Trading as a Business Workshop
- VectorVest 7 EOD
- VectorVest 7 RealTime/IntraDay
- VectorVest AutoTester
- VectorVest Educational Services
- VectorVest OnLine
- VectorVest Options Analyzer
- VectorVest ProGraphics v6.0
- VectorVest ProTrader 7
- VectorVest RealTime Derby Tool
- VectorVest Simulator
- VectorVest Variator
- VectorVest Watchdog
