HOT TOPICS LIST
- MACD
- Fibonacci
- RSI
- Gann
- ADXR
- Stochastics
- Volume
- Triangles
- Futures
- Cycles
- Volatility
- ZIGZAG
- MESA
- Retracement
- Aroon
INDICATORS LIST
LIST OF TOPICS
PRINT THIS ARTICLE
by Matt Blackman
There is an adage in the stock market that says the market is near a top when everybody is bullish. It is assumed that the bulls have already gone long, leaving very few buyers on the sidelines to do so later. So is this the case now with the S&P 500?
Position: N/A
Matt Blackman
Matt Blackman is a full-time technical and financial writer and trader. He produces corporate and financial newsletters, and assists clients in getting published in the mainstream media. He is the host of TradeSystemGuru.com. Matt has earned the Chartered Market Technician (CMT) designation. Find out what stocks and futures Matt is watching on Twitter at www.twitter.com/RatioTrade
PRINT THIS ARTICLE
VOLATILITY
Stocks Getting Toppy?
02/15/12 09:09:23 AMby Matt Blackman
There is an adage in the stock market that says the market is near a top when everybody is bullish. It is assumed that the bulls have already gone long, leaving very few buyers on the sidelines to do so later. So is this the case now with the S&P 500?
Position: N/A
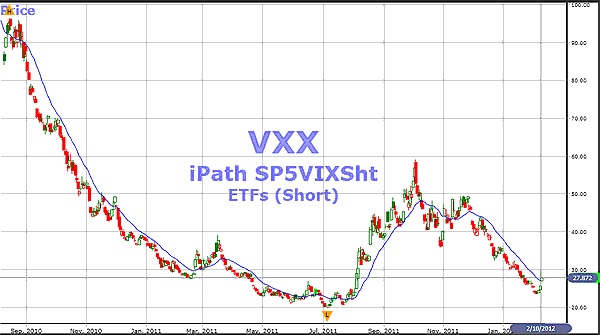
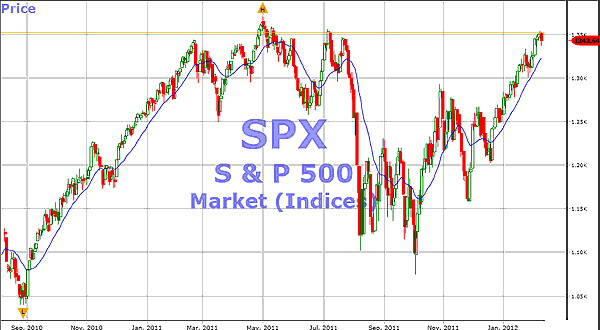
| In Figures 1 and 2, we see the iPath S&P500 VIX Short-Term Futures, which shows the volatility of the SPX. Note that it put in a low in July 2011, two months after the Standard & Poor's 500, after which the latter fell out of bed, losing 18%. Once volatility puts in a bottom, it's only a matter of time before volatility cranks up again, which usually means a drop in stock prices. In this case, the VXX low in early July coincided with a lower high in the SPX, just before the wheels fell off stocks. |

|
| FIGURE 1: VXX. Note that the VXX put in a low in July 2011, two months after the S&P 500, after which the latter fell out of bed, losing 18%. |
| Graphic provided by: VectorVest.com. |
| |
| So is the market getting tired? Tom McClellan, the author of the "McClellan Market Report," believes so. In a February 6th interview with Bloomberg (www.bloomberg.com/video/85818000/), he described how investor optimism was getting stretched, a relationship that is confirmed by the correlation between stocks and eurodollar futures. In the interview, McClellan discussed how well the movement in eurodollar futures the previous year has anticipated stock market movements in a relationship he says has been tradable since the late 1990s. |

|
| FIGURE 2: SPX. Note that the 30-day weighted moving averages in the upper and lower charts (blue line) confirm one another -- the top one issuing a buy signal and the bottom getting near to a sell. |
| Graphic provided by: VectorVest.com. |
| |
| "Commercial eurodollar traders tend to know a year in advance what is coming in the stock market. You see the same movements that occurred in Commitment of Traders commercial eurodollar futures one year later in the stock market. It's not a perfect indicator, it's merely very good," according to McClellan. |
| He believes short-term traders will be able to buy low and sell higher repeatedly for the next few months, but investors will be frustrated as the market churns sideways until about June. In Figure 2, McClellan showed the relationship between the Rydex Money Market Fund Flows and the S&P 500, which confirmed that fund flows tend to run inversely to the direction of stocks. Fund flows have generally hit a top when stocks are near a bottom and vice versa in a relationship that he says has worked well since about 1997; when he sees everyone pulling out of cash and plowing it into stocks, a top of some sort is usually not far off. |
| These three indicators are by no means a guarantee that a top is imminent but simply suggestive that stocks are overbought. McClellan believes it will be a sideways market till about June, which will frustrate investors. Only time will tell if this relationship continued to hold this year, but there is one more indicator that confirms this take. According to Doug Short of http://advisorperspectives.com, volume confirms this. In a February 7th report entitled "S&P 500 Update: Where's the Volume?," Short commented that SPX volume is down 19% in the first 24 trading days of this year versus the same period last year. A drop in volume doesn't necessarily mean that prices will drop, just that buyer participation is down, and without steady buying, it's usually only a matter of time before prices follow suit. |
Matt Blackman is a full-time technical and financial writer and trader. He produces corporate and financial newsletters, and assists clients in getting published in the mainstream media. He is the host of TradeSystemGuru.com. Matt has earned the Chartered Market Technician (CMT) designation. Find out what stocks and futures Matt is watching on Twitter at www.twitter.com/RatioTrade
| Company: | TradeSystemGuru.com |
| Address: | Box 2589 |
| Garibaldi Highlands, BC Canada | |
| Phone # for sales: | 604-898-9069 |
| Fax: | 604-898-9069 |
| Website: | www.tradesystemguru.com |
| E-mail address: | indextradermb@gmail.com |
Traders' Resource Links | |
| TradeSystemGuru.com has not added any product or service information to TRADERS' RESOURCE. | |
Click here for more information about our publications!
Comments

Request Information From Our Sponsors
- StockCharts.com, Inc.
- Candle Patterns
- Candlestick Charting Explained
- Intermarket Technical Analysis
- John Murphy on Chart Analysis
- John Murphy's Chart Pattern Recognition
- John Murphy's Market Message
- MurphyExplainsMarketAnalysis-Intermarket Analysis
- MurphyExplainsMarketAnalysis-Visual Analysis
- StockCharts.com
- Technical Analysis of the Financial Markets
- The Visual Investor
- VectorVest, Inc.
- Executive Premier Workshop
- One-Day Options Course
- OptionsPro
- Retirement Income Workshop
- Sure-Fire Trading Systems (VectorVest, Inc.)
- Trading as a Business Workshop
- VectorVest 7 EOD
- VectorVest 7 RealTime/IntraDay
- VectorVest AutoTester
- VectorVest Educational Services
- VectorVest OnLine
- VectorVest Options Analyzer
- VectorVest ProGraphics v6.0
- VectorVest ProTrader 7
- VectorVest RealTime Derby Tool
- VectorVest Simulator
- VectorVest Variator
- VectorVest Watchdog
