HOT TOPICS LIST
- MACD
- Fibonacci
- RSI
- Gann
- ADXR
- Stochastics
- Volume
- Triangles
- Futures
- Cycles
- Volatility
- ZIGZAG
- MESA
- Retracement
- Aroon
INDICATORS LIST
LIST OF TOPICS
PRINT THIS ARTICLE
by Donald W. Pendergast, Jr.
Shares of Raytheon have rebounded from a recent cycle low. Is this yet another surge en route to a new multimonth high?
Position: N/A
Donald W. Pendergast, Jr.
Donald W. Pendergast is a financial markets consultant who offers specialized services to stock brokers and high net worth individuals who seek a better bottom line for their portfolios.
PRINT THIS ARTICLE
TRADING SYSTEMS
RTN En Route To A New Multimonth High?
02/14/12 08:46:12 AMby Donald W. Pendergast, Jr.
Shares of Raytheon have rebounded from a recent cycle low. Is this yet another surge en route to a new multimonth high?
Position: N/A
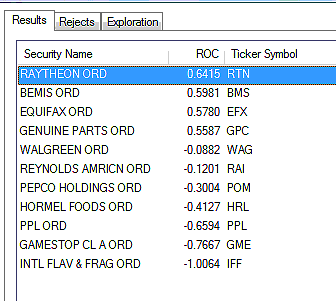
| Raytheon's (RTN) share price took quite a tumble last summer, and for a while there the selloff got so extreme that the decline looked like the trajectory of a barrel going off the leading edge of Niagara Falls. After enduring a very chaotic period of consolidation from early August to late September 2011, the stock tested and retested several key support levels, finally giving traders and investors in this stock some relief after starting to rebound again in early October 2011. Being one of the highest dividend-yielding large cap stocks around (currently paying 3.4% annually), value investors began to realize that the need for RTN's high-tech military defense hardware and systems wasn't about to suddenly dry up, and when the worst (so far, that is) of the euro debt mess apparently over and done with, such income-oriented investors and traders began to pile back into RTN en masse, driving the stock up from $38.35 in late September 2011 all the way to $50.70 by late January 2012, a 58.2% gain in four months. With such a strong uptrend still in force, the recent pullback to $47.50 may be nothing more serious than a typical 20-day cycle low, perhaps combined with a concerted effort by the strong hands in this stock to shakeout the weaker hands. With all that said, let's see what the current trade setup is for RTN's daily time frame. See Figures 1 and 2. |

|
| FIGURE 1: RELATIVE STRENGTH. The top relative strength (versus the .SPX) large-cap stocks firing long RMO swing buy signals at the close of trading on February 9, 2012. |
| Graphic provided by: MetaStock. |
| Graphic provided by: MetaStock Explorer. |
| |
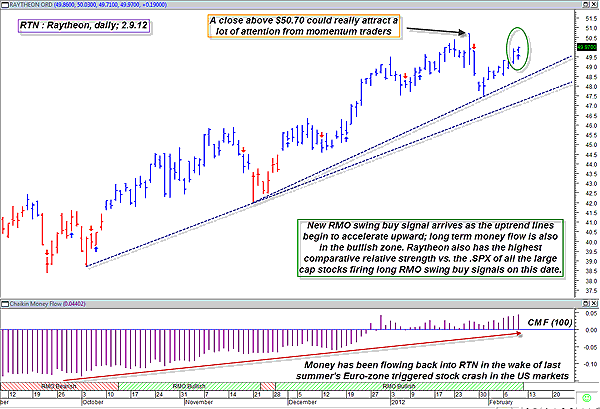
| A new Rahul Mohindar (RMO) trading system swing buy signal fired on RTN's daily chart after the close on February 9, 2012; most RMO swing buy/sell signals appearing after a given market swing has already progressed to a certain degree, making it more like a trend-following strategy that enters on a breakout. I have noted over the years that the odds of success when trading these signals tend to increase by using these two simple confirmation rules: 1. Only take RMO swing buy/sell signals in the direction of the dominant trend. 2. Favor those RMO swing buy/sell signals that occur after a successful test/retest of significant support or resistance. Glancing at Figure 2, it's easy to confirm that this new signal for RTN passes both of those tests, but bear in mind that what I believe is significant support & resistance or the dominant trend in this stock may differ from what you observe and comprehend on this same exact chart. There is some measure of subjective analysis involved, but the more experience you have with charting and with real-live trading, the easier it will be for you to come to your own valid and potentially profitable conclusions about meaningful trend and/or support & resistance interpretations. |

|
| FIGURE 2: RTN, DAILY. RMO swing buy/sell signals appear to offer greater profit potential when traded in the direction of the dominant trend after a test of significant support or resistance. Thus, in this example, the new long entry signal for RTN appears to be a good candidate for bullish traders and investors to consider. |
| Graphic provided by: MetaStock. |
| Graphic provided by: RMO trading system indicators from MetaStock 11. |
| |
| One aspect of this chart that isn't subjective in nature is the very strong long-term money flow trend, as depicted by the 100-period Chaikin money flow histogram. Clearly, big money interests have built positions in this stock since early autumn 2011, and they don't seem to be put off at all by the recent pullback, jumping back in to buy even more of the stock. If RTN can clear the previous swing high of $50.70 sooner rather than later, the stock has fairly clear sailing until it hits the $51.75 and $53.12 levels. Those swing highs were the highest achieved by RTN in all of 2011 and will likely create significant turbulence should RTN hit them within the next few weeks. |
| Traders going long on this signal (the buy-stop entry price being approximately $50.04 for this long setup) may want to rely on a three-bar trailing stop to manage the position from start to finish so as to ease the strain of "Where do I get out with a profit or a loss" kind of questions. More conservative traders may want to go the covered-call route using near-term calls that are slightly in-the-money. Such traders will probably want a looser stop to give such positions time to develop, despite minor pullbacks on the path to potentially higher prices. It's your choice, so consider your trading temperament and trading goals before putting on this or any other trade. |
Donald W. Pendergast is a financial markets consultant who offers specialized services to stock brokers and high net worth individuals who seek a better bottom line for their portfolios.
| Title: | Writer, market consultant |
| Company: | Linear Trading Systems LLC |
| Jacksonville, FL 32217 | |
| Phone # for sales: | 904-239-9564 |
| E-mail address: | lineartradingsys@gmail.com |
Traders' Resource Links | |
| Linear Trading Systems LLC has not added any product or service information to TRADERS' RESOURCE. | |
Click here for more information about our publications!
PRINT THIS ARTICLE

Request Information From Our Sponsors
- StockCharts.com, Inc.
- Candle Patterns
- Candlestick Charting Explained
- Intermarket Technical Analysis
- John Murphy on Chart Analysis
- John Murphy's Chart Pattern Recognition
- John Murphy's Market Message
- MurphyExplainsMarketAnalysis-Intermarket Analysis
- MurphyExplainsMarketAnalysis-Visual Analysis
- StockCharts.com
- Technical Analysis of the Financial Markets
- The Visual Investor
- VectorVest, Inc.
- Executive Premier Workshop
- One-Day Options Course
- OptionsPro
- Retirement Income Workshop
- Sure-Fire Trading Systems (VectorVest, Inc.)
- Trading as a Business Workshop
- VectorVest 7 EOD
- VectorVest 7 RealTime/IntraDay
- VectorVest AutoTester
- VectorVest Educational Services
- VectorVest OnLine
- VectorVest Options Analyzer
- VectorVest ProGraphics v6.0
- VectorVest ProTrader 7
- VectorVest RealTime Derby Tool
- VectorVest Simulator
- VectorVest Variator
- VectorVest Watchdog
