HOT TOPICS LIST
- MACD
- Fibonacci
- RSI
- Gann
- ADXR
- Stochastics
- Volume
- Triangles
- Futures
- Cycles
- Volatility
- ZIGZAG
- MESA
- Retracement
- Aroon
INDICATORS LIST
LIST OF TOPICS
PRINT THIS ARTICLE
by Billy Williams
Once a fast-moving momentum stock, Google has been floundering on its price chart in recent years. But something big is forming that could lead to major profits for you.
Position: Buy
Billy Williams
Billy Williams has been trading the markets for 27 years, specializing in momentum trading with stocks and options.
PRINT THIS ARTICLE
CHART ANALYSIS
Google's Triangle Setup
02/14/12 11:11:53 AMby Billy Williams
Once a fast-moving momentum stock, Google has been floundering on its price chart in recent years. But something big is forming that could lead to major profits for you.
Position: Buy
| Google launched as a publicly traded company back in 2004, with tons of media coverage and lots of hype as investment bankers created massive buzz around selling the shares of a company that was on the cutting edge of search engine technology. This new technology was the result of its constantly in-flux algorithms that gave it a huge competitive edge over other search engine firms like Yahoo and the neglected MSN, a subsection of Microsoft. After the initial launch, frenzied buying followed as investors wanted a piece of the "new thing" that everyone was sure was guaranteed to make money. For the astute trader, however, what followed was a huge opportunity to enjoy the runup while sidestepping what followed and now, years later, another runup may be in the making. However, to understand the lucrative opportunity that seems to be developing, it's important that you, the trader, understand what happened in the past up to the present and what will likely follow. |

|
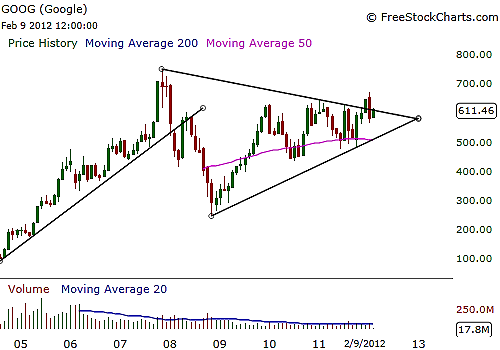
| FIGURE 1: GOOG, MONTHLY. On the monthly price chart, Google has formed a bullish symmetrical triangle after its price action had been foundering in a contracted price range. |
| Graphic provided by: www.freestockcharts.com. |
| |
| Google (GOOG) (Figures 1 and 2) is a search engine that uses intuitive technology to deliver search results for its users. Like an organism, it is constantly evolving as well as morphing into a higher, more functional piece of technology that delivers more accurate search results to its users while remaining user-friendly. It has a massive appetite for the personal search habits of its users along with their personal information, which has caused it to be the subject of a great deal of criticism from its detractors. That said, it is the 800-pound gorilla in the Internet world, commanding as high as 70% of the estimated web users who prefer to use its search engine for search results. Because of the high demand for its search engine, Google has been the darling of major corporations and small businesses who use its paid search feature to bid on keywords that Google's users type in to find results to advertise directly to information seekers and consumers. In addition, Google has acquired companies such as YouTube.com and others that attract large amounts of viewers in order to leverage its search traffic and develop platforms to tie consumer and potential businesses together. |

|
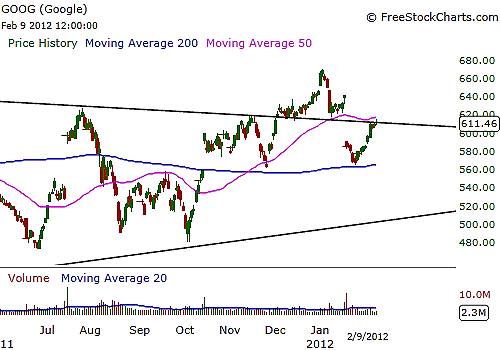
| FIGURE 2: GOOG, WEEKLY. Google's price briefly broke higher before dipping below the upper trendline on the chart pattern, but this is normal. What is needed now is for price to move to a two-month high and pull back for you to enter a position, then adjust your stops as it makes the necessary higher highs and higher lows in its price action. |
| Graphic provided by: www.freestockcharts.com. |
| |
| GOOG's initial public offering took its shares to market at around $100 a share initially, and over the next three years, it went as high as $747 for a potential 747% return before suffering a steep decline. The decline was the result of a creative and innovative twist on its paid search features, which instead of keywords being awarded to advertisers purely on the basis of how their bid was, instead gave preference to bidders whose ads had the highest percentage of click-throughs. Even more, GOOG began to give discounts to advertisers who showed the initiative to improve their ads for higher click-through rates, which on the surface shocked its shareholders as analysts at large. The result was that its stock dropped as observers became confused about what was going on with management to make such a decision and what would be the end result. While many were confused as to what the outcome would be, in the end, GOOG pulled off a major coup as the higher click-through rates ultimately led to more money being made and advertisers were forced to create hyper-competitive ads that led to a more positive experience for the searcher. |
| Unfortunately, in early 2008, GOOG's price action broke major support and formed a lower price high in May of that year and a lower low followed in November, confirming a trend reversal. Price then oscillated back and forth on the monthly chart as price entered a period of contraction and formed a bullish symmetrical triangle. Now, price has broken through the upper trendline of the triangle but then retreated below it, which is typical of chart patterns on the larger time frames. |
| At this critical point in GOOG's price history, the chart pattern that has formed suggests that Google is set to hit a price target of just over $1,100 a share. To take advantage of that, you have to stalk this trade and wait for price to make an eight-week high and wait for a pullback in price, then enter a position. Google's price action should be highlighted by higher highs and higher lows in its upward price movement with adjustable stop-loss orders underneath each corresponding higher price low, just under the established intraday low. |
Billy Williams has been trading the markets for 27 years, specializing in momentum trading with stocks and options.
| Company: | StockOptionSystem.com |
| E-mail address: | stockoptionsystem.com@gmail.com |
Traders' Resource Links | |
| StockOptionSystem.com has not added any product or service information to TRADERS' RESOURCE. | |
Click here for more information about our publications!
PRINT THIS ARTICLE

Request Information From Our Sponsors
- VectorVest, Inc.
- Executive Premier Workshop
- One-Day Options Course
- OptionsPro
- Retirement Income Workshop
- Sure-Fire Trading Systems (VectorVest, Inc.)
- Trading as a Business Workshop
- VectorVest 7 EOD
- VectorVest 7 RealTime/IntraDay
- VectorVest AutoTester
- VectorVest Educational Services
- VectorVest OnLine
- VectorVest Options Analyzer
- VectorVest ProGraphics v6.0
- VectorVest ProTrader 7
- VectorVest RealTime Derby Tool
- VectorVest Simulator
- VectorVest Variator
- VectorVest Watchdog
- StockCharts.com, Inc.
- Candle Patterns
- Candlestick Charting Explained
- Intermarket Technical Analysis
- John Murphy on Chart Analysis
- John Murphy's Chart Pattern Recognition
- John Murphy's Market Message
- MurphyExplainsMarketAnalysis-Intermarket Analysis
- MurphyExplainsMarketAnalysis-Visual Analysis
- StockCharts.com
- Technical Analysis of the Financial Markets
- The Visual Investor
