HOT TOPICS LIST
- MACD
- Fibonacci
- RSI
- Gann
- ADXR
- Stochastics
- Volume
- Triangles
- Futures
- Cycles
- Volatility
- ZIGZAG
- MESA
- Retracement
- Aroon
INDICATORS LIST
LIST OF TOPICS
PRINT THIS ARTICLE
by Koos van der Merwe
Here's a share that suggested a failed bull symmetrical triangle in May 2011.
Position: Accumulate
Koos van der Merwe
Has been a technical analyst since 1969, and has worked as a futures and options trader with First Financial Futures in Johannesburg, South Africa.
PRINT THIS ARTICLE
CUP WITH HANDLE
Another Look At Westmoreland Coal
02/13/12 08:55:32 AMby Koos van der Merwe
Here's a share that suggested a failed bull symmetrical triangle in May 2011.
Position: Accumulate
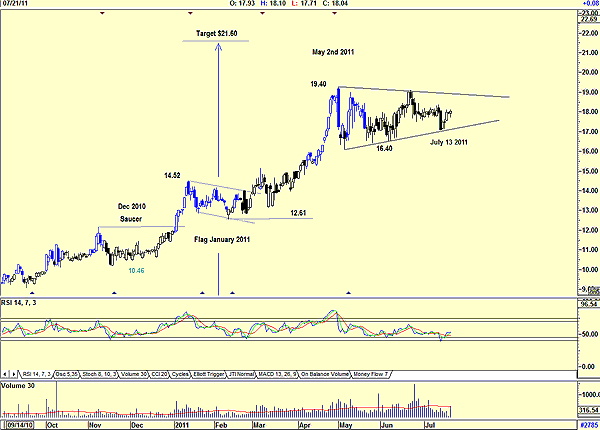
| All the signs were there for a strong rise. In December 2010, a saucer formation formed, which forecasted a rise from $10.46 to $14.52, and the stock, Westmoreland Coal (WLB), reached its target. WLB then traced a flag pattern in January 2011, suggesting a target of $21.60, and the price rose to $19.40 by May 2, 2011. The relative strength index (RSI) shown in Figure 1 met every buy & sell signal and gave a new buy signal in July 13, 2011, and the price started rising on increasing volume. All this is shown in Figure 1. |

|
| FIGURE 1: WESTMORELAND COAL HISTORICAL |
| Graphic provided by: AdvancedGET. |
| |
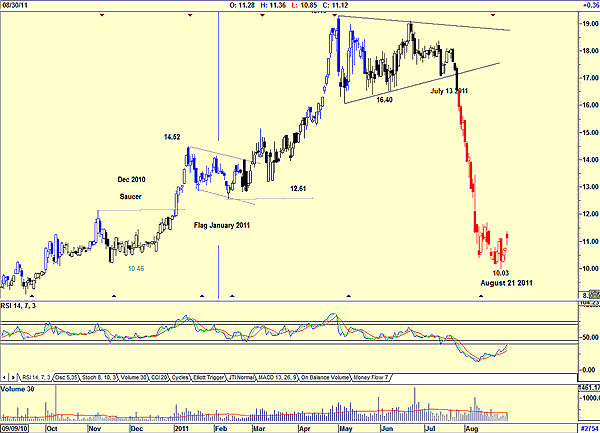
| All the signs are there for the share price to rise even higher. The price formed a triangular pattern from May 2, 2011, suggesting a continuation of the rise, but something went wrong. Unless we spent time looking at fundamentals, technical charts did not show it. Triangles have been known to reverse a trend. They are periods of consolidation and form during periods of indecision between buyers and sellers. Figure 2 shows that this indecision led to a collapse in the share price, as shown. |

|
| FIGURE 2: WLB CHART SHOWING THE FAILURE OF THE SYMMETRICAL TRIANGLE PATTERN |
| Graphic provided by: AdvancedGET. |
| |
| The price of WLB fell from a high of $19.40 to a low of $10.03, a pretty significant fall in price. Why did this occur? We should look at the fundamentals to work out why. As chartists, we only want to know what our charts forecast. For this analysis, let us have a look at Figure 3. |

|
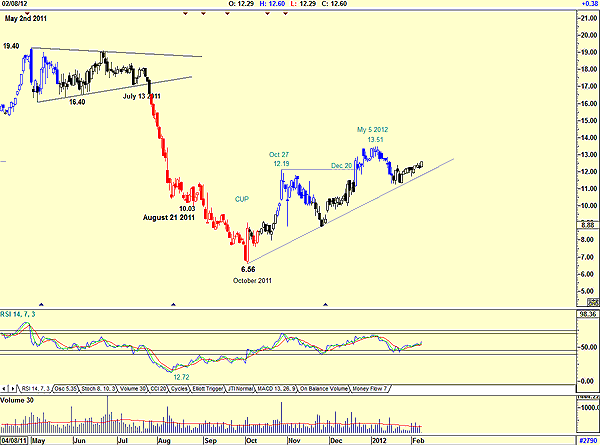
| FIGURE 3: CHART SHOWING THE RECOVERY WITH A SUGGESTED BUY |
| Graphic provided by: AdvancedGET. |
| |
| Figure 3 shows how the price fell further from $10.03 in August 21 to a low of $6.56 by October 2011 in spite of the RSI buy signal. The indicator fell to extreme oversold lows of 12. When the RSI falls below 32, it is in oversold territory, and we start to look for a buy signal, when it breaks above the 32 level. To fall to a low of 12 suggests an extreme oversold level, and traders with high-risk personalities would have started nibbling at the stock as long as the fundamentals were sound. The price then rose to $12.19 by October 27, suggesting a cup with handle formation. We would then wait for a break above the handle (12.19) for a buy signal. This happened on December 20, and with a rising RSI, we would have bought. The price as of this writing is $12.60, and with a rising RSI, we could be a buyer with a target of $13.51, the pivot point resistance level of May 5. |
Has been a technical analyst since 1969, and has worked as a futures and options trader with First Financial Futures in Johannesburg, South Africa.
| Address: | 3256 West 24th Ave |
| Vancouver, BC | |
| Phone # for sales: | 6042634214 |
| E-mail address: | petroosp@gmail.com |
Click here for more information about our publications!
PRINT THIS ARTICLE

Request Information From Our Sponsors
- VectorVest, Inc.
- Executive Premier Workshop
- One-Day Options Course
- OptionsPro
- Retirement Income Workshop
- Sure-Fire Trading Systems (VectorVest, Inc.)
- Trading as a Business Workshop
- VectorVest 7 EOD
- VectorVest 7 RealTime/IntraDay
- VectorVest AutoTester
- VectorVest Educational Services
- VectorVest OnLine
- VectorVest Options Analyzer
- VectorVest ProGraphics v6.0
- VectorVest ProTrader 7
- VectorVest RealTime Derby Tool
- VectorVest Simulator
- VectorVest Variator
- VectorVest Watchdog
- StockCharts.com, Inc.
- Candle Patterns
- Candlestick Charting Explained
- Intermarket Technical Analysis
- John Murphy on Chart Analysis
- John Murphy's Chart Pattern Recognition
- John Murphy's Market Message
- MurphyExplainsMarketAnalysis-Intermarket Analysis
- MurphyExplainsMarketAnalysis-Visual Analysis
- StockCharts.com
- Technical Analysis of the Financial Markets
- The Visual Investor
