HOT TOPICS LIST
- MACD
- Fibonacci
- RSI
- Gann
- ADXR
- Stochastics
- Volume
- Triangles
- Futures
- Cycles
- Volatility
- ZIGZAG
- MESA
- Retracement
- Aroon
INDICATORS LIST
LIST OF TOPICS
PRINT THIS ARTICLE
by Donald W. Pendergast, Jr.
When a powerful trend takes hold, it generally pays to give such a market move the respect it deserves.
Position: N/A
Donald W. Pendergast, Jr.
Donald W. Pendergast is a financial markets consultant who offers specialized services to stock brokers and high net worth individuals who seek a better bottom line for their portfolios.
PRINT THIS ARTICLE
CHART ANALYSIS
Not A Time To Pick Market Tops In .SPX
02/10/12 09:22:31 AMby Donald W. Pendergast, Jr.
When a powerful trend takes hold, it generally pays to give such a market move the respect it deserves.
Position: N/A
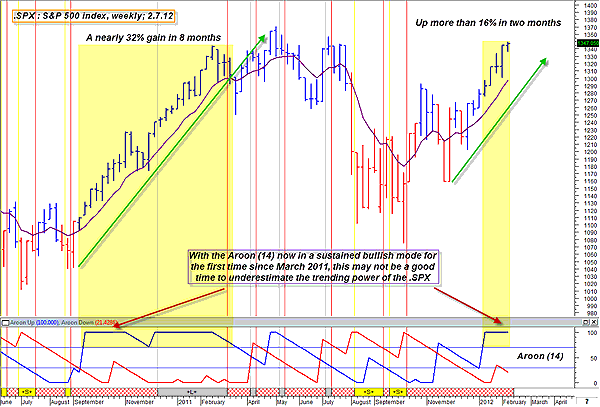
| There really is a commonality to most major market reversals. After enduring the summer 2011 "euro-crash" contagion and then another two months of thrill-ride, go-nowhere fakeout moves, all of a sudden comes the dramatic market surge of October 2011. Clearly, it seemed to be the first tangible sign that traders and investors were not about to give up on the equities market just yet, but some lingering fears over the euro debt and US economic mess still seemed to loom large as the market endured a significant retracement of the October surge in November 2011. But then the new higher low paved the way for another minor swing higher into early December followed by yet another higher low -- also in December -- and lo and behold, the .SPX was once again in a de facto uptrend, much to the amazement of permabears everywhere. Here in early February 2012, investors continue to pile into this bullish party even as the permabear naysayers continue to assert that this largecap index has simply gone too far, too fast. Such permabears might well take a look at the weekly chart of .SPX (Figure 1) to see just how strong the last major weekly bullish trend move in the index actually was. The thing tacked on nearly 32% in a little over eight months, and if you discounted the last retracement before the final surge to the May 2011 high, they'll find the index still gained about 28% in less than six months. When the .SPX decides to get into bullish mode, its trending power can be impressive, to say the least. Currently, the .SPX has picked up more than 16% just since early December 2011, and with the weekly 14-period Aroon trend intensity indicator now in full-tilt bullish mode for the first time in nearly a year, wise traders and investors will definitely want to give this powerful, developing trend the measure of respect that it deserves. The .SPX is still trending nicely above its 10-week exponential moving average (EMA), which is also a reasonably good trend-delineating indicator for some forms of trading. And while no one can know for certain just how high this index will ultimately go -- if it goes much higher at all -- it's usually a safe choice to stick with the strongest stocks from the strongest industry groups and sectors for as long as this index of all stock indexes continues to surge upward. |

|
| FIGURE 1: SPX, WEEKLY. No indicator is perfect, but when the bullish half (blue line) of the Aroon indicator starts hanging around the 100 area, it's a confirmation of a strong bullish trend that has a good likelihood of continuing. |
| Graphic provided by: MetaStock. |
| Graphic provided by: CS Scientific expert from MetaStock 11. |
| |
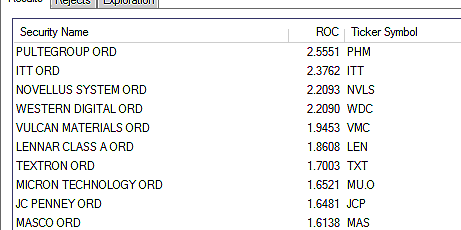
| The output for the MetaStock 13-week relative strength exploration highlights the top 10 large-cap stocks that have been outperforming the .SPX over the last calendar quarter, and the stocks hail from a variety of groups, which is another excellent confirmation of the broad-based nature of this most recent rally (Figure 2). Do some research on your own and you may find a number of solid covered-call and swing trading opportunities available in any number of these stocks. Check it out. |

|
| FIGURE 2: TOP 10. The top 10 stocks in terms of 13-week relative strength vs. the .SPX. |
| Graphic provided by: MetaStock. |
| Graphic provided by: MetaStock Explorer. |
| |
Donald W. Pendergast is a financial markets consultant who offers specialized services to stock brokers and high net worth individuals who seek a better bottom line for their portfolios.
| Title: | Writer, market consultant |
| Company: | Linear Trading Systems LLC |
| Jacksonville, FL 32217 | |
| Phone # for sales: | 904-239-9564 |
| E-mail address: | lineartradingsys@gmail.com |
Traders' Resource Links | |
| Linear Trading Systems LLC has not added any product or service information to TRADERS' RESOURCE. | |
Click here for more information about our publications!
PRINT THIS ARTICLE

Request Information From Our Sponsors
- StockCharts.com, Inc.
- Candle Patterns
- Candlestick Charting Explained
- Intermarket Technical Analysis
- John Murphy on Chart Analysis
- John Murphy's Chart Pattern Recognition
- John Murphy's Market Message
- MurphyExplainsMarketAnalysis-Intermarket Analysis
- MurphyExplainsMarketAnalysis-Visual Analysis
- StockCharts.com
- Technical Analysis of the Financial Markets
- The Visual Investor
- VectorVest, Inc.
- Executive Premier Workshop
- One-Day Options Course
- OptionsPro
- Retirement Income Workshop
- Sure-Fire Trading Systems (VectorVest, Inc.)
- Trading as a Business Workshop
- VectorVest 7 EOD
- VectorVest 7 RealTime/IntraDay
- VectorVest AutoTester
- VectorVest Educational Services
- VectorVest OnLine
- VectorVest Options Analyzer
- VectorVest ProGraphics v6.0
- VectorVest ProTrader 7
- VectorVest RealTime Derby Tool
- VectorVest Simulator
- VectorVest Variator
- VectorVest Watchdog
