HOT TOPICS LIST
- MACD
- Fibonacci
- RSI
- Gann
- ADXR
- Stochastics
- Volume
- Triangles
- Futures
- Cycles
- Volatility
- ZIGZAG
- MESA
- Retracement
- Aroon
INDICATORS LIST
LIST OF TOPICS
PRINT THIS ARTICLE
by Gary Grosschadl
In a previous article (Nasdaq and The Dangerous Doji) a pattern of "doji rally killers" was illustrated. A combination of this bearish candlestick when a doji candlestick appears after a rally, in conjunction with the VIX (volatility index) coming off a substantial low, very often resulted in a substantial decline.
Position: N/A
Gary Grosschadl
Independent Canadian equities trader and technical analyst based in Peterborough
Ontario, Canada.
PRINT THIS ARTICLE
CHART ANALYSIS
Nasdaq's Dangerous Doji Reappears
05/21/02 11:16:32 AMby Gary Grosschadl
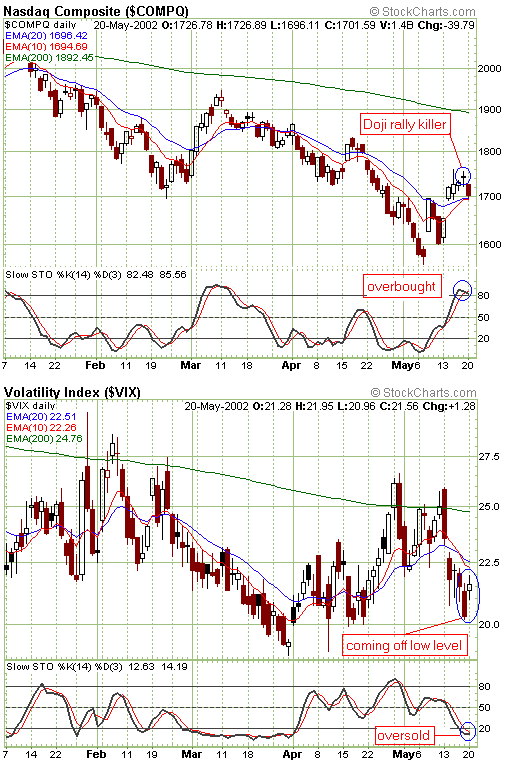
In a previous article (Nasdaq and The Dangerous Doji) a pattern of "doji rally killers" was illustrated. A combination of this bearish candlestick when a doji candlestick appears after a rally, in conjunction with the VIX (volatility index) coming off a substantial low, very often resulted in a substantial decline.
Position: N/A
| The doji candlestick represents indecision or a balance between bulls and bears. This sounds innocent enough but after a significant rise (in this case this recent move off the sub-1600 level) this indecisiveness usually is a "momentum robber." Nervous traders anxious to lock in short-term gains can bring down what is perceived as overbought levels and so a quick decline can result. A move above this doji candle negates this bearish implication but this seldom has occurred with this index while it has been suffering under the weight of too many moving averages. This recent rise was halted by the 50-day EMA (exponential moving average) but was left off the chart for visual clarity. |
| Interestingly, the shorter term EMAs -- the 10- and 20-day EMAs are trying to offer some short-term support and success or failure here in the near-term, are crucial to the short-term outcome. The fact that these bear rallies are falling short of challenging the "boss" 200-day EMA line is not a good sign, not to mention that this closely watched moving average is still sloping downwards. Many of the big players will be reluctant to step up to the plate as long as this index remains so challenged by these critical levels -- the 50- and 200-day EMAs. |

|
| Graphic provided by: stockcharts.com. |
| |
| Also very apparent on this chart is how the stochastic downturn from overbought levels has traced out the bear rally declines of this index. We are at another similar juncture here with stochastics turning down once again. |
| The VIX which shows a powerful inverse relationship here (also covered in previous articles) also has stochastics trying to reverse from oversold levels. Unfortunately bear rallies are still ruling the day and until we see convincing proof chart wise, traders should continue to tread carefully through the market's quagmire, choosing sectors carefully if at all. Standing aside can be a prudent strategy for the risk averse. |
Independent Canadian equities trader and technical analyst based in Peterborough
Ontario, Canada.
| Website: | www.whatsonsale.ca/financial.html |
| E-mail address: | gwg7@sympatico.ca |
Click here for more information about our publications!
Comments
Date: 05/21/02Rank: 4Comment:
Date: 05/21/02Rank: 3Comment:
Date: 05/22/02Rank: 5Comment:
Date: 05/24/02Rank: 4Comment:
Date: 06/07/02Rank: 4Comment:

Request Information From Our Sponsors
- VectorVest, Inc.
- Executive Premier Workshop
- One-Day Options Course
- OptionsPro
- Retirement Income Workshop
- Sure-Fire Trading Systems (VectorVest, Inc.)
- Trading as a Business Workshop
- VectorVest 7 EOD
- VectorVest 7 RealTime/IntraDay
- VectorVest AutoTester
- VectorVest Educational Services
- VectorVest OnLine
- VectorVest Options Analyzer
- VectorVest ProGraphics v6.0
- VectorVest ProTrader 7
- VectorVest RealTime Derby Tool
- VectorVest Simulator
- VectorVest Variator
- VectorVest Watchdog
- StockCharts.com, Inc.
- Candle Patterns
- Candlestick Charting Explained
- Intermarket Technical Analysis
- John Murphy on Chart Analysis
- John Murphy's Chart Pattern Recognition
- John Murphy's Market Message
- MurphyExplainsMarketAnalysis-Intermarket Analysis
- MurphyExplainsMarketAnalysis-Visual Analysis
- StockCharts.com
- Technical Analysis of the Financial Markets
- The Visual Investor
