HOT TOPICS LIST
- MACD
- Fibonacci
- RSI
- Gann
- ADXR
- Stochastics
- Volume
- Triangles
- Futures
- Cycles
- Volatility
- ZIGZAG
- MESA
- Retracement
- Aroon
INDICATORS LIST
LIST OF TOPICS
PRINT THIS ARTICLE
by Billy Williams
Using technical analysis and pattern recognition, you can spot simple pullback setups with enormous profit potential.
Position: Buy
Billy Williams
Billy Williams has been trading the markets for 27 years, specializing in momentum trading with stocks and options.
PRINT THIS ARTICLE
TECHNICAL ANALYSIS
SPX Price Targets And Setups
02/09/12 08:48:44 AMby Billy Williams
Using technical analysis and pattern recognition, you can spot simple pullback setups with enormous profit potential.
Position: Buy
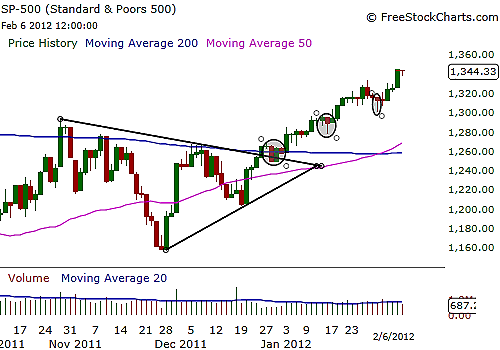
| From the peak in October 2011 followed by the low in November, the SPX set the stage for a bullish symmetrical triangle pattern that has acted as a springboard for the upward price movement in the market as the bulls have seized control of the trend. From a chartist's point of view, there is a difference of 133 SPX points between the two price levels mentioned previously, which calls for them to be added at the point of the breakout in play in order to estimate the profit target for the triangle pattern, giving you a target of 1388 on the current upward price swing. At this point, it's important to stress that technical analysis and pattern recognition are reliable tools to understanding the context of the market as you begin to implement key trade setups. For example, in the current context, the SPX has emerged from a period of price contraction where its price action formed a bullish symmetrical triangle then broke higher, but if you had missed the initial move, there is not reason to panic because any basic pullback approach would have revealed at least three entries where you could have entered the move and emerged a winner. See Figure 1. |

|
| FIGURE 1: SPX. In 2011, from October to November, the SPX formed a bullish symmetrical triangle that offered three pullback setups from the time that the price broke higher. |
| Graphic provided by: www.freestockcharts.com. |
| |
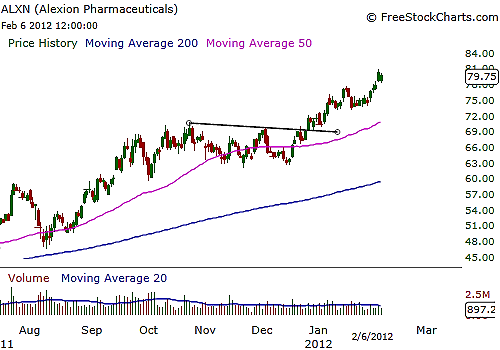
| On December 29, 2011, January 13, 2012, and January 30, 2012, price pulled back enough to allow you to enter the move as it resumed its upward move. Now, as price approached a key target level -- 1388 -- it's important to be mindful that the current breakout expansion may have run its course and revert to a period of contraction again. In the meanwhile, stock leaders such as Alexion Pharmaceuticals (ALXN) have led the market higher by resisting the back-and-forth trading that the SPX went through beginning in October 2011 with its stock trading near its all-time highs. However, as 70% or more of the market moves in tandem with the larger market, specifically the SPX, you'll see that many stocks moved up at the same time, but stock leaders like ALXN actually tipped their hand to astute traders by beginning to break higher with the rest of the market following suit. See Figure 2. |

|
| FIGURE 2: ALXN. Alexion Pharmaceuticals, a stock leader in the current market, started moving higher two days before the SPX neared its all-time high, leading the market to new highs. |
| Graphic provided by: www.freestockcharts.com. |
| |
| This is a good example as to why it's important to look for the strongest stocks in the market because they will usually begin to move higher before the rest of the market but while they will ratchet up the gains faster than your average blue-chip stocks. ALXN, for example, signaled an entry on December 27, two days before the SPX, trading above the $70 price level and going on to trade as high as $80 in just over a month for a 10-point gain, or 14%. Using call options, the potential return could have been even greater. |
| Now, as the SPX approaches the 1388 level, you have to be alert at any signs of price entering a consolidation phase and/or trend reversal. If momentum begins to slow or volume drop off, then these are warning signs that you have to lower your profit expectations or, at the very least, tighten up your stop-loss orders as an insurance policy against any reversal against your position. Still, in the meantime, the bulls have control, so look for high relative strength stocks and trade with a bias to the upside. |
Billy Williams has been trading the markets for 27 years, specializing in momentum trading with stocks and options.
| Company: | StockOptionSystem.com |
| E-mail address: | stockoptionsystem.com@gmail.com |
Traders' Resource Links | |
| StockOptionSystem.com has not added any product or service information to TRADERS' RESOURCE. | |
Click here for more information about our publications!
PRINT THIS ARTICLE

Request Information From Our Sponsors
- StockCharts.com, Inc.
- Candle Patterns
- Candlestick Charting Explained
- Intermarket Technical Analysis
- John Murphy on Chart Analysis
- John Murphy's Chart Pattern Recognition
- John Murphy's Market Message
- MurphyExplainsMarketAnalysis-Intermarket Analysis
- MurphyExplainsMarketAnalysis-Visual Analysis
- StockCharts.com
- Technical Analysis of the Financial Markets
- The Visual Investor
- VectorVest, Inc.
- Executive Premier Workshop
- One-Day Options Course
- OptionsPro
- Retirement Income Workshop
- Sure-Fire Trading Systems (VectorVest, Inc.)
- Trading as a Business Workshop
- VectorVest 7 EOD
- VectorVest 7 RealTime/IntraDay
- VectorVest AutoTester
- VectorVest Educational Services
- VectorVest OnLine
- VectorVest Options Analyzer
- VectorVest ProGraphics v6.0
- VectorVest ProTrader 7
- VectorVest RealTime Derby Tool
- VectorVest Simulator
- VectorVest Variator
- VectorVest Watchdog
