HOT TOPICS LIST
- MACD
- Fibonacci
- RSI
- Gann
- ADXR
- Stochastics
- Volume
- Triangles
- Futures
- Cycles
- Volatility
- ZIGZAG
- MESA
- Retracement
- Aroon
INDICATORS LIST
LIST OF TOPICS
PRINT THIS ARTICLE
by Donald W. Pendergast, Jr.
Biotech stocks are pulling far ahead of the rest of the stock market in terms of relative strength.
Position: N/A
Donald W. Pendergast, Jr.
Donald W. Pendergast is a financial markets consultant who offers specialized services to stock brokers and high net worth individuals who seek a better bottom line for their portfolios.
PRINT THIS ARTICLE
REL. STR COMPARATIVE
FBIOX Screaming Higher
02/08/12 11:29:06 AMby Donald W. Pendergast, Jr.
Biotech stocks are pulling far ahead of the rest of the stock market in terms of relative strength.
Position: N/A
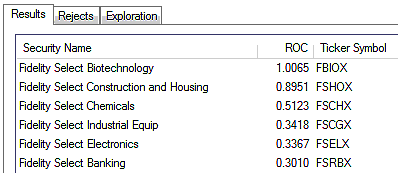
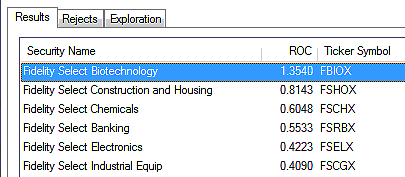
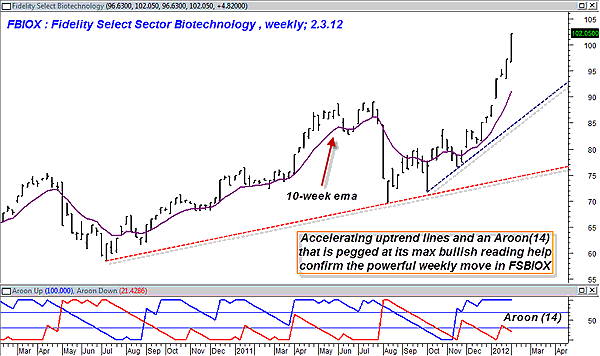
| With the proliferation of exchange traded funds (ETFs) since 1993, it may be hard to believe that some traders still prefer to trade old-fashioned sector mutual funds instead. For traders who like to ride sustained trends and don't need intraday switching capability, though, sector mutual funds can still offer many opportunities for skilled traders and investors. Here's a look at the very impressive relative strength rankings for the top six Fidelity select sector funds, followed by a look at the weekly chart for the Fidelity Select Sector Biotechnology fund (FBIOX). See Figures 1, 2, and 3. |

|
| FIGURE 1: TOP SIX FUNDS. The top six Fidelity Select Sector funds (based on their 13-week RS versus the .SPX) for the week ended January 27, 2012. |
| Graphic provided by: MetaStock. |
| Graphic provided by: MetaStock Explorer. |
| |
| If you've been trading or investing for at least 20 years, you may recall the time when biotech stocks were the hottest thing available in the entire stock market. Circa 1991, it was hard not to read all sorts of articles in the mainstream financial media regarding this "can't lose, can't miss" industry group, most of it being very bullish and optimistic for this group's near- and long-term growth prospects. Of course, the great biotech stock boom of the early 1990s did fade in due course, with the Internet stocks becoming the next big thing just a few years later. Then it was the gold/silver mining stocks (dirt cheap in the early 2000s), homebuilder stocks from 2001 to 2006 and uranium mining stocks in 2006 to 2008. All of these powerful bull moves came to screeching halts at some point, once the last buyer had made his or her purchase, and then experienced major trend reversals and/or significant corrections. The big idea here is this: no matter how overpowering, compelling, or convincing the near- and/or long-term growth prospects are for any given stock, industry group, or sector, to be a successful position trader or long-term investor, you need to be aware of the sector rotation factors that are at work in the market so that you aren't always jumping on board a market move that, though strong, could be faltering in terms of relative strength. Essentially, you always want to have your money at work in sectors/groups that are outperforming not only the broad market, but also the majority of other market sectors/groups as well. Last week, I ranked all of the Fidelity Sector funds in terms of their 13-week relative strength vs. the .SPX; the top six funds were the biotech, construction/housing, chemicals, industrial equipment, electronics, and banking sector funds, respectively. I ran the same group of funds at the end of last week's trading action and found some interesting trends within the data: A. The biotech fund (FBIOX) continues to strengthen against the .SPX and against all other sector funds. B. The banking fund (FSRBX) is rapidly increasing in strength against the .SPX and all other sector funds, moving up from sixth place to fourth place. C. The construction/housing fund (FSHOX), although still in second place, has actually weakened in relative strength versus the.SPX. This is important information, especially for sector fund traders who rely on momentum and relative strength (RS) timing methods to move in and out of positions. For example, if you were just starting to trade a momentum/RS-based sector fund method, you might want to only allocate your cash to those funds that were increasing in strength vs. the .SPX and the other sector funds. As a result, you might very well pass on the construction/housing fund but decide to allocate money to the biotech, banking, and chemicals sector funds instead. Then you would simply run your relative strength rankings at the end of this trading week and go through the process again, always striving to keep placing your funds into the top-performing sector funds, week after week. |

|
| FIGURE 2: TOP SIX FUNDS. The top six Fidelity Select Sector funds (based on their 13-week RS versus the .SPX) for the week ended February 3, 2012. Note that FBIOX continues to strengthen and that FSRBX has moved up from sixth to fourth place. Meanwhile, FSHOX has actually begun to weaken. |
| Graphic provided by: MetaStock. |
| Graphic provided by: MetaStock Explorer. |
| |
| The weekly chart for FBIOX clearly depicts a runaway bullish trend (for the moment); the Aroon (14) trend intensity indicator is at its maximum bullish value and the trendlines are also indicating an accelerating trend. The stock is also well above its 10-week exponential moving average (EMA). While the fund may be appearing as if it's going a bit parabolic, true momentum/RS traders know that they aren't in the business of trying to call tops and bottoms in any market. Instead, they simply ride strong trends for as long as possible, moving their money to other outperforming sector funds as former leaders begin to falter and fade. It is a fascinating form of trading, to be sure, but you still need to develop a firm set of rules and also a way to backtest, forward test, and stress test, and then objectively evaluate the historical performance of any such method that you may wish to implement. A fully tested and approved method that you have complete confidence in is the ultimate goal for every serious trader and investor after all, isn't it? |

|
| FIGURE 3: FBIOX, WEEKLY. The weekly chart for FBIOX easily confirms the increasing relative strength and upward momentum that was identified in the MetaStock 13-week relative strength exploration. |
| Graphic provided by: MetaStock. |
| |
Donald W. Pendergast is a financial markets consultant who offers specialized services to stock brokers and high net worth individuals who seek a better bottom line for their portfolios.
| Title: | Writer, market consultant |
| Company: | Linear Trading Systems LLC |
| Jacksonville, FL 32217 | |
| Phone # for sales: | 904-239-9564 |
| E-mail address: | lineartradingsys@gmail.com |
Traders' Resource Links | |
| Linear Trading Systems LLC has not added any product or service information to TRADERS' RESOURCE. | |
Click here for more information about our publications!
Comments

Request Information From Our Sponsors
- StockCharts.com, Inc.
- Candle Patterns
- Candlestick Charting Explained
- Intermarket Technical Analysis
- John Murphy on Chart Analysis
- John Murphy's Chart Pattern Recognition
- John Murphy's Market Message
- MurphyExplainsMarketAnalysis-Intermarket Analysis
- MurphyExplainsMarketAnalysis-Visual Analysis
- StockCharts.com
- Technical Analysis of the Financial Markets
- The Visual Investor
- VectorVest, Inc.
- Executive Premier Workshop
- One-Day Options Course
- OptionsPro
- Retirement Income Workshop
- Sure-Fire Trading Systems (VectorVest, Inc.)
- Trading as a Business Workshop
- VectorVest 7 EOD
- VectorVest 7 RealTime/IntraDay
- VectorVest AutoTester
- VectorVest Educational Services
- VectorVest OnLine
- VectorVest Options Analyzer
- VectorVest ProGraphics v6.0
- VectorVest ProTrader 7
- VectorVest RealTime Derby Tool
- VectorVest Simulator
- VectorVest Variator
- VectorVest Watchdog
