HOT TOPICS LIST
- MACD
- Fibonacci
- RSI
- Gann
- ADXR
- Stochastics
- Volume
- Triangles
- Futures
- Cycles
- Volatility
- ZIGZAG
- MESA
- Retracement
- Aroon
INDICATORS LIST
LIST OF TOPICS
PRINT THIS ARTICLE
by Koos van der Merwe
The idea behind using a moving average is to establish a smooth sequence in graphical terms.
Position: Accumulate
Koos van der Merwe
Has been a technical analyst since 1969, and has worked as a futures and options trader with First Financial Futures in Johannesburg, South Africa.
PRINT THIS ARTICLE
MOVING AVERAGES
Using Moving Averages
02/07/12 08:46:03 AMby Koos van der Merwe
The idea behind using a moving average is to establish a smooth sequence in graphical terms.
Position: Accumulate
| Listening to the various TV announcers, I am inclined to shudder when they talk about the golden cross, or the death cross, or any other type of "cross" to predict market direction. All are based on moving averages. But what exactly is a moving average? As an example, in a 10-day moving average, we calculate the average over 10 days. The next day, day 11, we eliminate day 1 from the calculation and add day 11. On day 12, the figure for day 2 is eliminated and day 12 added, and so on. As easy as this sounds, from an analytical point of view, the problem with a moving average is that they often reflect false penetrations. For example, the share price may have risen steadily, but with the earlier data in the average, the historical factor may prevent this rise from being seen. When the historical factors are removed, the price improvement appears to be more dramatic than it really is. One way to handle this problem is to use an exponentially smoothed moving average. This is a mathematical way of removing violent fluctuations so that only the real breaks are detectable. |

|
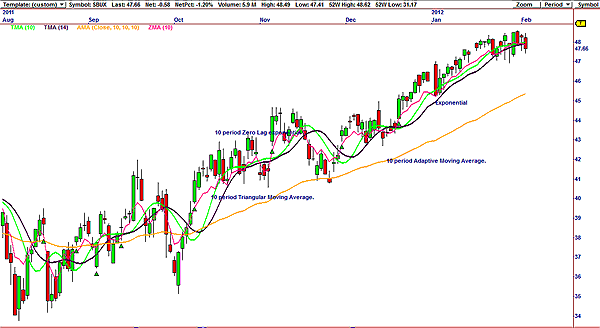
| FIGURE 1: SHOWING MOVING AVERAGES |
| Graphic provided by: Omnitrader. |
| |
| Of course, in any computer programs, there are now weighted moving averages, triangular moving averages, adaptive moving averages, and even zero-lag moving averages. Not all of them work in forecasting the trend, but they do give us an idea of what is happening to the share price. Figure 1 shows four different moving averages: 1. A 10-period triangular (green) 2. A 10-period zero-lag exponential (red) 3. A 10-period exponential (black) 4. A 10-period adaptive (orange) Just by examining the chart, you can see that the 10-period zero-lag exponential moving average gave trader buy sell signals, whereas the 10-period adaptive moving average gave signals that were more conducive to investing for the long term. |

|
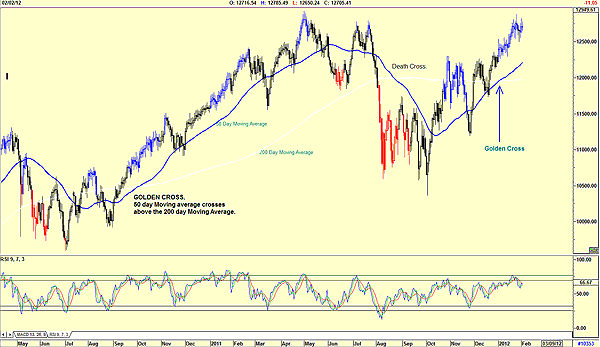
| FIGURE 2: THE GOLDEN CROSS AND THE DEATH CROSS |
| Graphic provided by: AdvancedGET. |
| |
| Figure 2 shows a golden cross on the Dow Jones Industrial Average (DJIA). That is where a 50-day moving average rises above a 200-day average. A death cross is the reverse, when a 50-day moving average falls below the 200-day moving average. A golden cross hints that the stock market will rally and a death cross that the market is going into a recession. Note how late the indicator is in forecasting the market. The golden cross indicator is suggesting that the DJIA is in a major bull trend, but the relative strength index (RSI) is suggesting a short-term sell signal. Note also that although the golden cross signal in September 2010 gave an early warning of the trend, and the death cross in August 2011 gave a signal almost at market bottom. Worth watching, yes, but other moving averages as suggested in Figure 1 are far more profitable. |

|
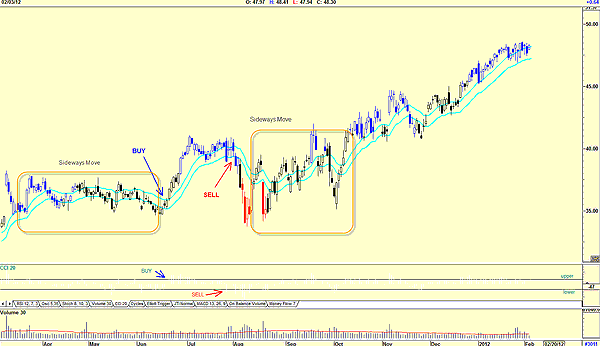
| FIGURE 3: THE PROBLEM WITH THE JM INTERNAL BAND |
| Graphic provided by: AdvancedGET. |
| |
| In Figure 3, I have returned to the Starbucks chart (SBUX). Here I have used the JM internal band indicator, but rather than using a simple moving average, I have used a 15-period exponential moving average offset by 2% positive and 2% negative rather than my preferred simple moving average. A buy signal is triggered when the price breaks above the upper band, and a sell signal is given when it breaks below the lower band. When the price moves sideways, the problems could occur, in that buy/sell signals are triggered much too quickly. This can be confusing, as shown on the chart. To assist us in making a final decision, we would use another indicator like a commodity channel index (CCI) as shown as a confirmation. A CCI only gives a buy signal when the indicator rises above the upper horizontal, and a sell signal when it falls below the lower horizontal. Currently, Starbucks is moving sideways but has not given a sell signal yet. So do moving averages work? It is all in how you look at it. |
Has been a technical analyst since 1969, and has worked as a futures and options trader with First Financial Futures in Johannesburg, South Africa.
| Address: | 3256 West 24th Ave |
| Vancouver, BC | |
| Phone # for sales: | 6042634214 |
| E-mail address: | petroosp@gmail.com |
Click here for more information about our publications!
PRINT THIS ARTICLE

Request Information From Our Sponsors
- StockCharts.com, Inc.
- Candle Patterns
- Candlestick Charting Explained
- Intermarket Technical Analysis
- John Murphy on Chart Analysis
- John Murphy's Chart Pattern Recognition
- John Murphy's Market Message
- MurphyExplainsMarketAnalysis-Intermarket Analysis
- MurphyExplainsMarketAnalysis-Visual Analysis
- StockCharts.com
- Technical Analysis of the Financial Markets
- The Visual Investor
- VectorVest, Inc.
- Executive Premier Workshop
- One-Day Options Course
- OptionsPro
- Retirement Income Workshop
- Sure-Fire Trading Systems (VectorVest, Inc.)
- Trading as a Business Workshop
- VectorVest 7 EOD
- VectorVest 7 RealTime/IntraDay
- VectorVest AutoTester
- VectorVest Educational Services
- VectorVest OnLine
- VectorVest Options Analyzer
- VectorVest ProGraphics v6.0
- VectorVest ProTrader 7
- VectorVest RealTime Derby Tool
- VectorVest Simulator
- VectorVest Variator
- VectorVest Watchdog
