

HOT TOPICS LIST
- MACD
- Fibonacci
- RSI
- Gann
- ADXR
- Stochastics
- Volume
- Triangles
- Futures
- Cycles
- Volatility
- ZIGZAG
- MESA
- Retracement
- Aroon
INDICATORS LIST
LIST OF TOPICS
PRINT THIS ARTICLE
by Donald W. Pendergast, Jr.
Now that E-Trade Financial shares have made a higher swing high and higher swing low, is this new buy signal the spark to ignite a new round of buying in the stock?
Position: N/A
Donald W. Pendergast, Jr.
Donald W. Pendergast is a financial markets consultant who offers specialized services to stock brokers and high net worth individuals who seek a better bottom line for their portfolios.
PRINT THIS ARTICLE
SUPPORT & RESISTANCE
E-Trade Financial Uptrend Strengthening?
02/07/12 10:48:52 AMby Donald W. Pendergast, Jr.
Now that E-Trade Financial shares have made a higher swing high and higher swing low, is this new buy signal the spark to ignite a new round of buying in the stock?
Position: N/A
| Of all of the possible technical trading topics that can be discussed, few, if any, are more important than that of the study of support and resistance (S/R). Once a trader and/or investor finally begins to grasp just how vital this concept is to their trading success, it's very likely that they will begin to look at the markets in an entirely new light, one that may help them stay on the right side of a given market more often than not. Here's a look at the interesting daily chart setup for ETFC. See Figure 1. |
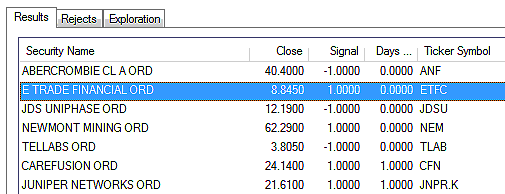
|
| FIGURE 1: RAFF MARKET SPACE. The Raff MarketSpace Stock System large-cap buy signals for February 2, 2012. |
| Graphic provided by: MetaStock. |
| Graphic provided by: MetaStock Explorer. |
| |
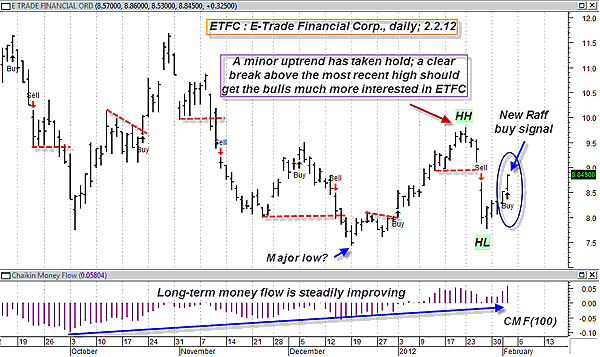
| Take a big-picture look at this daily chart for ETFC (Figure 2), disregarding the buy/sell signals, indicators, and notations for the moment. As you look at it, what is the simplest, "dumb as a box of rocks" dynamic that you see on the chart, one that is repeated over and over again? If you come to the conclusion that the cyclical nature or ETFC's swing moves is the real key, you are very observant, but that's not the basic, elemental dynamic at work here but rather one of the effects of the primary cause at work on this chart -- or any other chart. The basic building block for any swing and/or trending move (bullish or bearish) is that of the previous price bar's high (low) being exceeded by a subsequent bar's price action. In other words, the S/R formed by the prior bar's (you can apply this concept to tick, volume- or time-based bars on any time frame, it doesn't matter) high or low must be exceeded in order for a swing or trend move to occur. Therefore, the single-most important, absolutely vital thing that must occur to have a tradable opportunity is for a previous bar's high or low to be exceeded. Of course, to have a sustained swing/trend move, you need many consecutive instances of the prior bar's high (low) to be exceeded, but that just proves the point anyway -- the driving force underlying all tradable market moves is when price moves above/below a previous high or low. Period. Certainly, a successful trader doesn't just buy every new high (whether it's a 52-week high or just an extended swing high after a stock has made an impressive upswing) and all trade setups need to be evaluated within a broader concept that may include the use of a mechanical system, fundamental analysis, seasonal analysis, and relative strength factors. But at its core, the concept of S/R levels being exceeded actually undergirds all of these separate market analysis disciplines, one way or another. |
|
| FIGURE 2: ETFC, DAILY. Raff buy/sell signals occurring just beyond or near key S/R levels seem to have a very good chance of follow-through in this particular stock. |
| Graphic provided by: MetaStock. |
| Graphic provided by: Raff MarketSpace Stock System from MetaStock 11. |
| |
| With that little technical primer out of the way, let's see what we can learn from a quick study of E-Trade Financial's daily graph: 1. This is one stock that seems to love to embark on very smooth, very tradable swing moves in either direction -- a swing trader's dream. Once it decides on a new direction, the S/R concept as applied to daily highs/lows being exceeded works beautifully on this stock. 2. The Raff MarketSpace Stock system (a MetaStock 11 expert advisor) tends to fire buy/sell signals at about halfway through ETFC's successful market swings. On swings with limited follow-through, the Raff signals tend to fail. 3. Raff signals that are triggered (on a break above/below the signal bar's high or low) frequently do so in conjunction with corresponding breaks to meaningful chart support levels (red dashed lines on chart). 4. ETFC has made a higher swing high (HH) and a higher swing low (HL), so technically, it's in an uptrend. A near-term confirmed break and close above $9.80 (the previous swing high) will be a very bullish development. 5. The long-term money flow trend is strengthening (also a series of higher highs and higher lows on the 100-period Chaikin money flow histogram), which adds some extra bullish overtones to the big picture. For near-term swing traders, the latest Raff buy signal (if triggered on a rise above $8.85) could provide some opportunities for putting on a new long position, perhaps using a 30- to 60-minute chart to help fine-tune entry/exit strategies. |
| Support and resistance isn't the only important technical concept to understand, but it surely must rank right near the top of all must-have market understandings for all traders and investors. |
Donald W. Pendergast is a financial markets consultant who offers specialized services to stock brokers and high net worth individuals who seek a better bottom line for their portfolios.
| Title: | Writer, market consultant |
| Company: | Linear Trading Systems LLC |
| Jacksonville, FL 32217 | |
| Phone # for sales: | 904-239-9564 |
| E-mail address: | lineartradingsys@gmail.com |
Traders' Resource Links | |
| Linear Trading Systems LLC has not added any product or service information to TRADERS' RESOURCE. | |
Click here for more information about our publications!
PRINT THIS ARTICLE

Request Information From Our Sponsors
- StockCharts.com, Inc.
- Candle Patterns
- Candlestick Charting Explained
- Intermarket Technical Analysis
- John Murphy on Chart Analysis
- John Murphy's Chart Pattern Recognition
- John Murphy's Market Message
- MurphyExplainsMarketAnalysis-Intermarket Analysis
- MurphyExplainsMarketAnalysis-Visual Analysis
- StockCharts.com
- Technical Analysis of the Financial Markets
- The Visual Investor
- VectorVest, Inc.
- Executive Premier Workshop
- One-Day Options Course
- OptionsPro
- Retirement Income Workshop
- Sure-Fire Trading Systems (VectorVest, Inc.)
- Trading as a Business Workshop
- VectorVest 7 EOD
- VectorVest 7 RealTime/IntraDay
- VectorVest AutoTester
- VectorVest Educational Services
- VectorVest OnLine
- VectorVest Options Analyzer
- VectorVest ProGraphics v6.0
- VectorVest ProTrader 7
- VectorVest RealTime Derby Tool
- VectorVest Simulator
- VectorVest Variator
- VectorVest Watchdog