HOT TOPICS LIST
- MACD
- Fibonacci
- RSI
- Gann
- ADXR
- Stochastics
- Volume
- Triangles
- Futures
- Cycles
- Volatility
- ZIGZAG
- MESA
- Retracement
- Aroon
INDICATORS LIST
LIST OF TOPICS
PRINT THIS ARTICLE
by Donald W. Pendergast, Jr.
When a significant triangle pattern approaches completion, breakout traders begin to plan their method of engagement.
Position: N/A
Donald W. Pendergast, Jr.
Donald W. Pendergast is a financial markets consultant who offers specialized services to stock brokers and high net worth individuals who seek a better bottom line for their portfolios.
PRINT THIS ARTICLE
TRIANGLES
In Baker Hughes, A Triangle Pattern To Watch
02/02/12 09:16:14 AMby Donald W. Pendergast, Jr.
When a significant triangle pattern approaches completion, breakout traders begin to plan their method of engagement.
Position: N/A
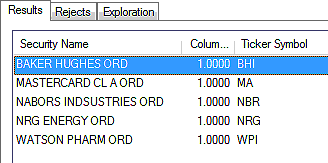
| Over the past few years, a good many of my Traders Advantage (TCA) pieces have featured a variety of RMO (Rahul Mohindar) swing buy/sell signal trade setups, and quite a few of them did go on to profitable completion. It's a terrific system that comes standard with MetaStock 11 and looks pretty good all by itself. However, I always add some sort of extra filter (Aroon or money flow readings or something -- check my past TCA articles for the particulars of each trade setup) in an attempt to locate the RMO setups with a higher probability of successful follow-through. Lately, however, I've been noticing something very exciting about the RMO swing buy/sell signals, and that's their tendency to follow through after having already made a successful test of meaningful support or resistance barriers. Here's a closer look at some of these findings in a daily chart of Baker Hughes (BHI) (Figures 1 and 2). |

|
| FIGURE 1: BHI. The five large-cap stocks firing RMO swing buy signals at the close of trading on January 27, 2012. |
| Graphic provided by: MetaStock. |
| Graphic provided by: MetaStock Explorer. |
| |
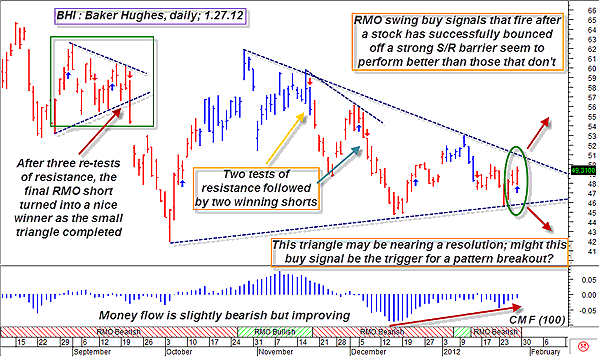
| In late August/early September 2011, BHI fired two long RMO swing signals and two short RMO swing signals within what eventually turned into a small triangle pattern. Note that the two buy signals (blue arrows) were duds, while the first short resulted in a minor loss and the final short turned into a big winner. The upper channel line of the triangle was formed by three (and nearly four) attempts of the stock to break higher. With each swing high, the resistance area became stronger. Then, as the triangle pattern became more obvious to savvy traders, the onset of the last short signal in the pattern was akin to waving a T-bone steak to a hungry dawg -- traders jumped on the pattern, tearing it to pieces as they sold short en masse, driving the price down significantly in just 10 trading sessions. A second example of this can be found within the larger triangle pattern, too. Look at the successful RMO shorts in mid-November 2011 and early December 2011. In both cases, BHI had tested important resistance levels before the RMO swing sell signals had printed. Interesting, to say the least, and from now on, I will always look at the proximity of any new RMO swing buy/sell signals to such test/retests of key support and resistance areas on the stocks that I follow. You may want to consider doing the same thing, too, as it could pay off in really big dividends and extra profits in the months and years to come. |

|
| FIGURE 2: BHI, DAILY. Some trading signals seem to have better profit potential if taken after meaningful tests of support or resistance have been completed. The current long signal in BHI certainly looks promising, coming on the heels of a successful major support test. |
| Graphic provided by: MetaStock. |
| Graphic provided by: RMO trading system indicators from MetaStock 11. |
| |
| Currently, BHI has now fired a RMO swing buy signal, one that also occurs fairly close to the support channel afforded by the lower boundary of the large triangle pattern. While no one knows if the trade will trigger (on a buy-stop entry above Friday's high of $49.69), but the trade setup is potentially desirable because the buy signal occurs very close to the triangle pattern's apex -- right after the recent swing low formed a three-point uptrend line as part of the lower portion of the pattern. All in all, looks like a good setup for skilled swing traders to take a controlled-risk shot at, perhaps trying for some modest intraday swing gains on any run higher up toward the upper channel line (near $51.00). If BHI can manage a break and daily close above the upper channel line, savvy traders will also want to wait for other intraday pullbacks to key intraday support/resistance like Fibonacci confluences, floor trader pivots, and/or key moving averages and intraday trendlines before establishing new long positions. An entire book could be written about how to play the market in any given situation. However, these ideas should help serious traders milk the maximum amount of gains possible from this stock in the next few days or weeks. |
| Your trading assignment this week is to plot all of the key trend and/or chart pattern lines on stocks firing RMO swing buy/sell signals to see if this is a concept worth pursuing in your own trading regimen. It could be a venture worth pursuing, especially if you are looking for ways to maximize the potential for profit with this unique trading system. |
Donald W. Pendergast is a financial markets consultant who offers specialized services to stock brokers and high net worth individuals who seek a better bottom line for their portfolios.
| Title: | Writer, market consultant |
| Company: | Linear Trading Systems LLC |
| Jacksonville, FL 32217 | |
| Phone # for sales: | 904-239-9564 |
| E-mail address: | lineartradingsys@gmail.com |
Traders' Resource Links | |
| Linear Trading Systems LLC has not added any product or service information to TRADERS' RESOURCE. | |
Click here for more information about our publications!
PRINT THIS ARTICLE

Request Information From Our Sponsors
- VectorVest, Inc.
- Executive Premier Workshop
- One-Day Options Course
- OptionsPro
- Retirement Income Workshop
- Sure-Fire Trading Systems (VectorVest, Inc.)
- Trading as a Business Workshop
- VectorVest 7 EOD
- VectorVest 7 RealTime/IntraDay
- VectorVest AutoTester
- VectorVest Educational Services
- VectorVest OnLine
- VectorVest Options Analyzer
- VectorVest ProGraphics v6.0
- VectorVest ProTrader 7
- VectorVest RealTime Derby Tool
- VectorVest Simulator
- VectorVest Variator
- VectorVest Watchdog
- StockCharts.com, Inc.
- Candle Patterns
- Candlestick Charting Explained
- Intermarket Technical Analysis
- John Murphy on Chart Analysis
- John Murphy's Chart Pattern Recognition
- John Murphy's Market Message
- MurphyExplainsMarketAnalysis-Intermarket Analysis
- MurphyExplainsMarketAnalysis-Visual Analysis
- StockCharts.com
- Technical Analysis of the Financial Markets
- The Visual Investor
