HOT TOPICS LIST
- MACD
- Fibonacci
- RSI
- Gann
- ADXR
- Stochastics
- Volume
- Triangles
- Futures
- Cycles
- Volatility
- ZIGZAG
- MESA
- Retracement
- Aroon
INDICATORS LIST
LIST OF TOPICS
PRINT THIS ARTICLE
by Gary Grosschadl
Trading sudden reversal patterns can be high risk/reward. Biomira, a Canadian biotech junior company provides a positive example of how to use several classic technical indicators to capture a lucrative short-term move.
Position: N/A
Gary Grosschadl
Independent Canadian equities trader and technical analyst based in Peterborough
Ontario, Canada.
PRINT THIS ARTICLE
TECHNICAL INDICATORS
Trading a Reversal Pattern Using Technical Indicators
05/20/02 07:50:37 PMby Gary Grosschadl
Trading sudden reversal patterns can be high risk/reward. Biomira, a Canadian biotech junior company provides a positive example of how to use several classic technical indicators to capture a lucrative short-term move.
Position: N/A
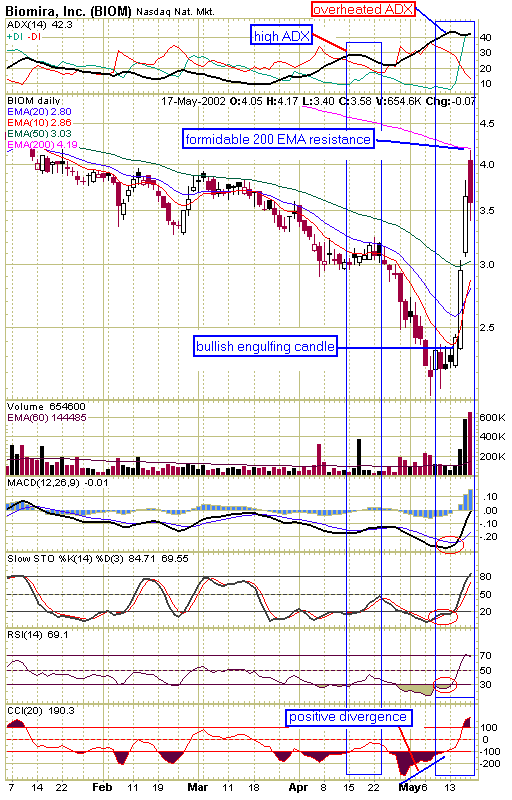
| Many traders use the directional movement indicator (DMI) to gauge trend strength and to point to reversal possibilities. This indicator uses three components - ADX (which is essentially measuring trend strength) and +/- DI which indicates whether the bulls or bears are in charge. I classify this play as "Overheated ADX Pushing for DI Reversal." When the ADX line rises above 40 and is above both DI lines, it's time to look for the possibility of a quick reversal. Watch for the DI lines to start to converge (ideally leading to an actual crossover) and for the ADX line to turn down from a peak. Note that back in April we had a similar, but not as powerful, ADX-type reversal. I call this a "High ADX pushing for DI reversal." Although ADX was above both DIs there was not enough power behind the move and after a very mediocre rise, stalled at the 20-day EMA (exponential moving average) line, typical of a bear rally. This does not mean all "High ADX" plays are mediocre, some will work well. Directional movement is not meant to be a standalone indicator (none are) but it does warrant a closer look for other signs of a change in price action. |
| In addition to the overheated ADX clue there were other bullish signs. The displayed indicators MACD (moving average convergence/divergence), STO (stochastics), RSI (relative strength indicator) and CCI (commodity channel index) all were coming off deeper oversold levels. Also note the bullish engulfing candle and the positive divergence of CCI. Price action was also very bullish, as the 20-day EMA level was resoundingly beaten, strongly hinting at further upside. |

|
| Graphic provided by: stockcharts.com. |
| |
| After three very bullish candles, the stock's rise was finally halted by the usually strong resistance of the 200-day EMA. This was a likely target for traders looking to lock in on these substantial short-term gains. |
| The stock is likely to retrace here as it pauses to regain strength before another possible assault against the 200-day EMA. Note how the indicators are looking toppy, being at overbought threshholds. However a sudden bullish move past 200-day EMA on continuing high volume despite Friday's poor candlestick would mean this move could go on, but traders would be dancing very close to the exits, making this a dangerous entry for new traders. |
| In conclusion, when looking for sudden reversal situations, look to several indicators for confirmation but don't be surprised if directional movement is pointing the way. |
Independent Canadian equities trader and technical analyst based in Peterborough
Ontario, Canada.
| Website: | www.whatsonsale.ca/financial.html |
| E-mail address: | gwg7@sympatico.ca |
Click here for more information about our publications!
Comments
Date: 05/21/02Rank: 5Comment:

|

Request Information From Our Sponsors
- StockCharts.com, Inc.
- Candle Patterns
- Candlestick Charting Explained
- Intermarket Technical Analysis
- John Murphy on Chart Analysis
- John Murphy's Chart Pattern Recognition
- John Murphy's Market Message
- MurphyExplainsMarketAnalysis-Intermarket Analysis
- MurphyExplainsMarketAnalysis-Visual Analysis
- StockCharts.com
- Technical Analysis of the Financial Markets
- The Visual Investor
- VectorVest, Inc.
- Executive Premier Workshop
- One-Day Options Course
- OptionsPro
- Retirement Income Workshop
- Sure-Fire Trading Systems (VectorVest, Inc.)
- Trading as a Business Workshop
- VectorVest 7 EOD
- VectorVest 7 RealTime/IntraDay
- VectorVest AutoTester
- VectorVest Educational Services
- VectorVest OnLine
- VectorVest Options Analyzer
- VectorVest ProGraphics v6.0
- VectorVest ProTrader 7
- VectorVest RealTime Derby Tool
- VectorVest Simulator
- VectorVest Variator
- VectorVest Watchdog
