HOT TOPICS LIST
- MACD
- Fibonacci
- RSI
- Gann
- ADXR
- Stochastics
- Volume
- Triangles
- Futures
- Cycles
- Volatility
- ZIGZAG
- MESA
- Retracement
- Aroon
INDICATORS LIST
LIST OF TOPICS
PRINT THIS ARTICLE
by James Kupfer
After a strong start for gold in 2012, the precious metal is facing a convergence of Fibonacci levels that could cause a pause in its upward move.
Position: Hold
James Kupfer
Mr. Kupfer is a market professional and amateur stock market commentator. Disclosure: It is likely that Mr. Kupfer has or will enter a position in any security he writes about.
PRINT THIS ARTICLE
FIBONACCI
Is Gold Losing Its Shine?
02/02/12 09:03:15 AMby James Kupfer
After a strong start for gold in 2012, the precious metal is facing a convergence of Fibonacci levels that could cause a pause in its upward move.
Position: Hold
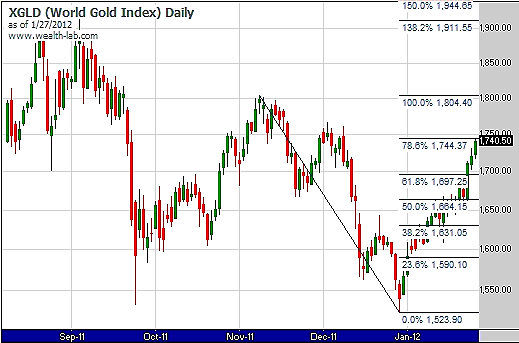
| Gold has been on a wild up since the start of 2012. On December 29, 2011, gold hit an intraday low of 1523. As of the close on January 27, 2012, a short month later, gold closed at 1740. That is an increase of roughly 14%. At this point, gold has approached a convergence of significant Fibonacci levels that may provide an opportunity for gold to temporarily retrace its current move. |

|
| FIGURE 1: XGLD, DAILY. Gold is at the 78.6% retracement level between the intermediate-term high in November and the December 2011 lows. |
| Graphic provided by: Wealth-Lab. |
| |
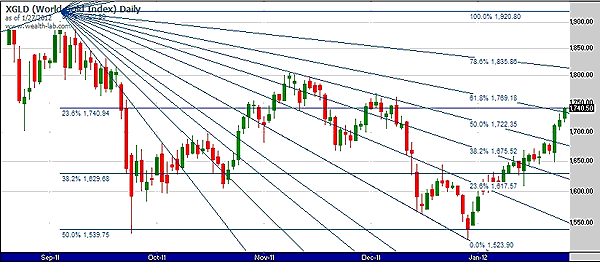
| Figure 1 depicts a Fibonacci fan drawn between the September 2011 high and December's low. Note how the 50% level perfectly picks the multiple tops in November and December. In January 2012, it almost again acted as resistance, but the market drove strongly up through it. |

|
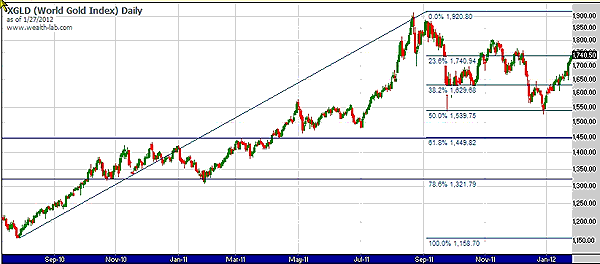
| FIGURE 2: XGLD, DAILY. Taking a longer view, gold is bumping up against a major resistance Fibonacci level, as can be seen here. The levels indicated have proven significant in the past. |
| Graphic provided by: Wealth-Lab. |
| |
| Given the obvious underlying strength in the price of gold, a retracement, if it occurs, will likely just be a temporary speed bump before higher prices are seen (Figure 2). This would allow gold to burn off the deeply overbought conditions and set the stage for higher prices that currently appear likely for the future. See Figure 3. |

|
| FIGURE 3: XGLD, DAILY. Gold is right at resistance of the Fibonacci fan. |
| Graphic provided by: Wealth-Lab. |
| |
Mr. Kupfer is a market professional and amateur stock market commentator. Disclosure: It is likely that Mr. Kupfer has or will enter a position in any security he writes about.
Click here for more information about our publications!
PRINT THIS ARTICLE

Request Information From Our Sponsors
- StockCharts.com, Inc.
- Candle Patterns
- Candlestick Charting Explained
- Intermarket Technical Analysis
- John Murphy on Chart Analysis
- John Murphy's Chart Pattern Recognition
- John Murphy's Market Message
- MurphyExplainsMarketAnalysis-Intermarket Analysis
- MurphyExplainsMarketAnalysis-Visual Analysis
- StockCharts.com
- Technical Analysis of the Financial Markets
- The Visual Investor
- VectorVest, Inc.
- Executive Premier Workshop
- One-Day Options Course
- OptionsPro
- Retirement Income Workshop
- Sure-Fire Trading Systems (VectorVest, Inc.)
- Trading as a Business Workshop
- VectorVest 7 EOD
- VectorVest 7 RealTime/IntraDay
- VectorVest AutoTester
- VectorVest Educational Services
- VectorVest OnLine
- VectorVest Options Analyzer
- VectorVest ProGraphics v6.0
- VectorVest ProTrader 7
- VectorVest RealTime Derby Tool
- VectorVest Simulator
- VectorVest Variator
- VectorVest Watchdog
