HOT TOPICS LIST
- MACD
- Fibonacci
- RSI
- Gann
- ADXR
- Stochastics
- Volume
- Triangles
- Futures
- Cycles
- Volatility
- ZIGZAG
- MESA
- Retracement
- Aroon
INDICATORS LIST
LIST OF TOPICS
PRINT THIS ARTICLE
by Koos van der Merwe
Volume tends to precede, predict, and confirm future trends.
Position: Accumulate
Koos van der Merwe
Has been a technical analyst since 1969, and has worked as a futures and options trader with First Financial Futures in Johannesburg, South Africa.
PRINT THIS ARTICLE
VOLUME
Volume And Trends
02/01/12 09:11:41 AMby Koos van der Merwe
Volume tends to precede, predict, and confirm future trends.
Position: Accumulate
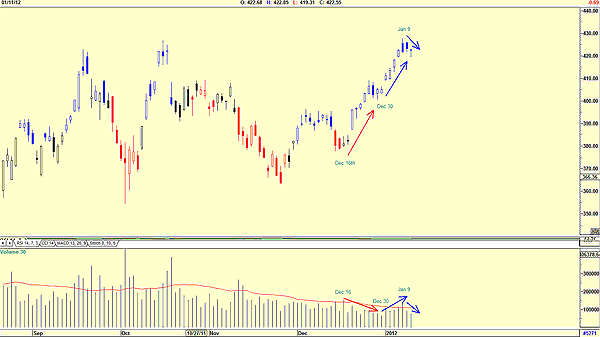
| Volume can be used to predict the direction of a stock price before a major announcement is made. We know the following: a. A price rise with a rise in volume = Bull b. A price rise with falling volume = Bear c. A price fall with falling volume = Bull d. A price fall with rising volume = Bear However, we put that aside whenever we know that the quarterly or yearly results of a company that we are interested in is due to be released within a week. Let us examine the volume of Apple (AAPL) shares before the financial results were released. |

|
| FIGURE 1: AAPL, DAILY |
| Graphic provided by: AdvancedGET. |
| |
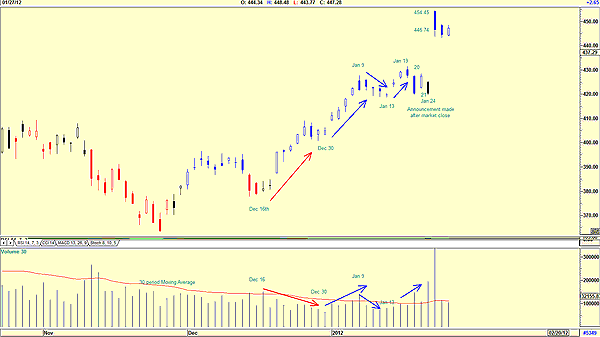
| In Figure 1, I have examined the shares of AAPL from December 16, 2011. Note how from that date, the share price started rising, but on falling volume, which is a sign of weakness. Was this because there were fewer investors in the market because of the Christmas season? Probably. The price of the share then started rising with rising volume until January 9, 2012, a sign of strength. From that date, both the share price and volume started falling, again a sign of weakness. So this is normal share market trading in anticipation of sales of the iPhone in China, which was met with great success. But these sales cannot be included on the results of the fourth quarter of 2011, when Apple reported a 73% jump in revenue. On Tuesday, January 24, 2012, Apple announced earnings per share of $13.87, blowing past analysts' forecasts of $10.10 per share. Was this outstanding result anticipated? Let us look at Figure 2. |

|
| FIGURE 2: AAPL, DAILY, TO JANUARY 27 |
| Graphic provided by: AdvancedGET. |
| |
| Figure 2 shows the following: a. Note how the price increased from January 13 along with the volume, a sign of strength. On January 20, volume fell on high volume, suggesting weakness. Market readers, anticipating a weak report for AAPL shares, could have started selling their shares. b. Then on January 21, the share price rose with volume above the 30-period moving average of volume, suggesting strength, followed by a fall once again on January 24 on even greater volume. Why the drop? Was this because analysts anticipated a poor result, or was this Apple executives calming the market before their announcement? c. Finally, AAPL reached a high of $454.45 and closed at $446.74 on January 25, falling lower on January 26 on smaller volume. This is not to say that there was insider trading on Apple shares, but there are those research analysts out there who do their homework with far greater accuracy than the majority of traders. It is therefore always worthwhile to study a chart carefully a few weeks before the financial result of a company is announced, and look for that up move on low volume in a rising volume trend a few days before the announcement date. Remember, to protect itself against insider trading, a company will try to weaken the share price before a major announcement, simply as a precaution. What for the future? Remember that a price will always fall to fill a gap before continuing to rise. |
Has been a technical analyst since 1969, and has worked as a futures and options trader with First Financial Futures in Johannesburg, South Africa.
| Address: | 3256 West 24th Ave |
| Vancouver, BC | |
| Phone # for sales: | 6042634214 |
| E-mail address: | petroosp@gmail.com |
Click here for more information about our publications!
Comments

Request Information From Our Sponsors
- StockCharts.com, Inc.
- Candle Patterns
- Candlestick Charting Explained
- Intermarket Technical Analysis
- John Murphy on Chart Analysis
- John Murphy's Chart Pattern Recognition
- John Murphy's Market Message
- MurphyExplainsMarketAnalysis-Intermarket Analysis
- MurphyExplainsMarketAnalysis-Visual Analysis
- StockCharts.com
- Technical Analysis of the Financial Markets
- The Visual Investor
- VectorVest, Inc.
- Executive Premier Workshop
- One-Day Options Course
- OptionsPro
- Retirement Income Workshop
- Sure-Fire Trading Systems (VectorVest, Inc.)
- Trading as a Business Workshop
- VectorVest 7 EOD
- VectorVest 7 RealTime/IntraDay
- VectorVest AutoTester
- VectorVest Educational Services
- VectorVest OnLine
- VectorVest Options Analyzer
- VectorVest ProGraphics v6.0
- VectorVest ProTrader 7
- VectorVest RealTime Derby Tool
- VectorVest Simulator
- VectorVest Variator
- VectorVest Watchdog
