HOT TOPICS LIST
- MACD
- Fibonacci
- RSI
- Gann
- ADXR
- Stochastics
- Volume
- Triangles
- Futures
- Cycles
- Volatility
- ZIGZAG
- MESA
- Retracement
- Aroon
INDICATORS LIST
LIST OF TOPICS
PRINT THIS ARTICLE
by Donald W. Pendergast, Jr.
Even though the broad markets have made a nice run already, there is no reason why stocks making new highs should not be on your watchlist.
Position: N/A
Donald W. Pendergast, Jr.
Donald W. Pendergast is a financial markets consultant who offers specialized services to stock brokers and high net worth individuals who seek a better bottom line for their portfolios.
PRINT THIS ARTICLE
NEW HIGHS-NEW LOWS
For LSI, A New High After A Big Gap
02/01/12 12:47:24 PMby Donald W. Pendergast, Jr.
Even though the broad markets have made a nice run already, there is no reason why stocks making new highs should not be on your watchlist.
Position: N/A
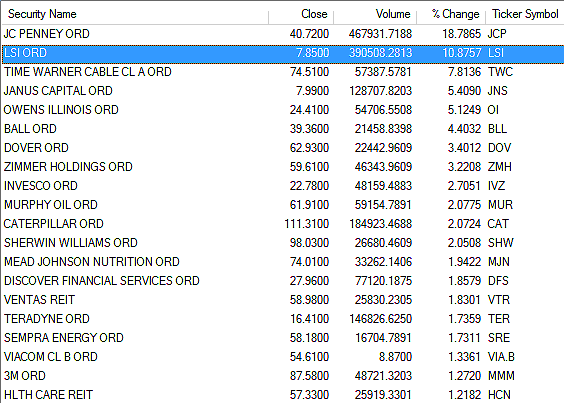
| In a previous Traders.com Advantage article, I highlighted a new (new to me, anyway) way to use several tools within MetaStock to construct a unique, yet very simple and totally objective and mechanical trading system. In fact, if you are already a MetaStock user, the system won't cost you anything; all of the components are built right into the program, and all you need to do is to put the pieces together before starting to measure its suitability for your own trading regimen. For the details on how to construct it within MetaStock, see my previous TCA piece. Right now, though, let's see how the system has performed lately on shares of LSI, a stock that just made a significant, multimonth high today. See Figure 1. |

|
| FIGURE 1: TOP 20. The top 20 new highs in the .SPX for January 26, 2012. |
| Graphic provided by: MetaStock. |
| Graphic provided by: MetaStock Explorer. |
| |
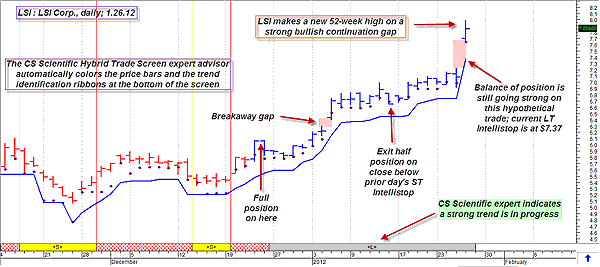
| LSI is a stock that can behave chaotically at times, with almost no apparent cyclical tendencies at all, but at other times it can go into a sustained, multimonth trend. The latter personality has apparent executive control over LSI's more recent day-to-day price history, what with the stock up by about 45% since the low of late November 2011, and LSI in a powerful uptrend -- one that may have just made an important continuation gap on Thursday, January 26, 2012. As in my previous article, the same MetaStock 11 expert advisor is applied to the price chart -- the CS Scientific Hybrid Trade Screen -- along with the short-term (ST) Intellistop (purple dots) and the long-term (LT) Intellistop. By simply entering a long position the morning after a confirmed price bar color change from red to blue, this hypothetical trade would still be hard at work, delivering profits. Like any trend-following method, there would be numerous whipsaws and early stopouts, but every so often a big trending move will appear, and that's where this system really shines. Even with exiting half the original position (profitably) on a daily close below the ST stop, the remaining half is still doing very well. And with the appearance of a likely continuation gap along with a new high, this might be one of the more suitable momentum stocks for swing traders to focus on in the next few sessions, just in case of a decent intraday pullback that might provide a suitable entry point. |

|
| FIGURE 2: LSI, DAILY. Not all long trade entries with this method work this well, but the combination of long- and short-term stops along with a simple, objective entry trigger makes this trend-following method a relatively stress-free affair. |
| Graphic provided by: MetaStock. |
| Graphic provided by: CS Scientific Expert from MetaStock 11. |
| |
| System tinkerers could also conceivably tweak this simple system, perhaps by including fundamental analysis (P/E ratios, earnings, sales growth trends, and so on) or even use sector/group relative strength rankings to help home in on stocks with a higher probability of making further gains. The choice is really up to you -- this could really be an idea for those who are looking for a cost-efficient trading method, one that doesn't cost $2,000, $3,000, or even $5,000 right out the gate. Play with it and see if it doesn't give you a few interesting ideas as to how to best put it to work for your own trading activities. |
Donald W. Pendergast is a financial markets consultant who offers specialized services to stock brokers and high net worth individuals who seek a better bottom line for their portfolios.
| Title: | Writer, market consultant |
| Company: | Linear Trading Systems LLC |
| Jacksonville, FL 32217 | |
| Phone # for sales: | 904-239-9564 |
| E-mail address: | lineartradingsys@gmail.com |
Traders' Resource Links | |
| Linear Trading Systems LLC has not added any product or service information to TRADERS' RESOURCE. | |
Click here for more information about our publications!
PRINT THIS ARTICLE

Request Information From Our Sponsors
- StockCharts.com, Inc.
- Candle Patterns
- Candlestick Charting Explained
- Intermarket Technical Analysis
- John Murphy on Chart Analysis
- John Murphy's Chart Pattern Recognition
- John Murphy's Market Message
- MurphyExplainsMarketAnalysis-Intermarket Analysis
- MurphyExplainsMarketAnalysis-Visual Analysis
- StockCharts.com
- Technical Analysis of the Financial Markets
- The Visual Investor
- VectorVest, Inc.
- Executive Premier Workshop
- One-Day Options Course
- OptionsPro
- Retirement Income Workshop
- Sure-Fire Trading Systems (VectorVest, Inc.)
- Trading as a Business Workshop
- VectorVest 7 EOD
- VectorVest 7 RealTime/IntraDay
- VectorVest AutoTester
- VectorVest Educational Services
- VectorVest OnLine
- VectorVest Options Analyzer
- VectorVest ProGraphics v6.0
- VectorVest ProTrader 7
- VectorVest RealTime Derby Tool
- VectorVest Simulator
- VectorVest Variator
- VectorVest Watchdog
