HOT TOPICS LIST
- MACD
- Fibonacci
- RSI
- Gann
- ADXR
- Stochastics
- Volume
- Triangles
- Futures
- Cycles
- Volatility
- ZIGZAG
- MESA
- Retracement
- Aroon
INDICATORS LIST
LIST OF TOPICS
PRINT THIS ARTICLE
by Donald W. Pendergast, Jr.
Some trading systems rely on neural nets or heavy-duty algorithms, but not this one. All that's really needed are your eyes and MetaStock 11.
Position: N/A
Donald W. Pendergast, Jr.
Donald W. Pendergast is a financial markets consultant who offers specialized services to stock brokers and high net worth individuals who seek a better bottom line for their portfolios.
PRINT THIS ARTICLE
TRADING SYSTEMS
Trading The SPX Visually
01/31/12 08:40:12 AMby Donald W. Pendergast, Jr.
Some trading systems rely on neural nets or heavy-duty algorithms, but not this one. All that's really needed are your eyes and MetaStock 11.
Position: N/A
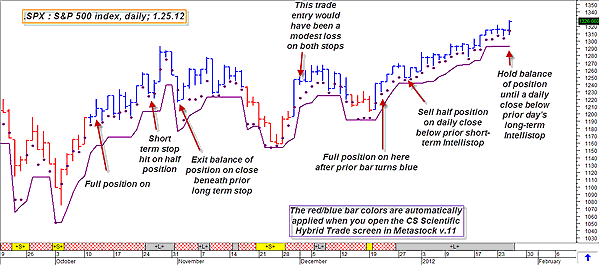
| I've used MetaStock 10 and 11 since August 2007, gradually noticing how some of the standard expert advisor templates could be juiced up by adding other indicators, creating my own unique expert advisor overlay for the stocks and ETFs that I regularly follow. I have long been impressed with the reliability and predictive power of the CS Scientific Hybrid Trade Screen expert, and it's been featured as a prominent analysis tool in many Traders Advantage articles over the last few years. In particular, it does a good job of alerting a trader or investor to times when a market is strongly trending (bullish or bearish) or just chopping around in a range. A yellow ribbon at the base of the chart means a powerful downtrend is in force, while a gray ribbon means a strong uptrend is a reality. The reddish crosshatch zones are more or less considered to be less than opportune times to trade, or at least that is my understanding of how to best apply it in my own charting and research activities. All this does a good job of alerting a trader to times when probabilities of a trend continuation move are higher (and thus a good time to put on positions) and those times (in the crosshatch zone) when standing aside might be a more prudent option. Lately, however, I've been trying to ignore the ribbons at the bottom of the chart (Figure 1) and am instead focusing on the changes in the bar colors -- particularly the change from red to blue -- as I observe how prices and trends interact with a short-and long-term pair of MetaStock Intellistops for long trade positions. The short-term stop (dark dots) closely tracks price, but does manage, in many cases, to allow a trader to profit from minor swings in the .SPX. The longer-term trail (solid line beneath the price bars) is designed to work in some regards like a volatility trailing stop would, allowing for modest pullbacks without stopping a trader out too early. As of late, this has been a very dynamic trading concept, at least in the .SPX. Assuming you had put on a full position (of shares in SPY or futures contracts in the emini or full-sized S&P 500) and took half off on a stopout of the prior day's short-term Intellistop and then held the balance of the position until a close below the previous day's long-term Intellistop, a trader would have made some reasonably decent money, at least since early October 2011. |

|
| FIGURE 1: SPX, DAILY. Sometimes, an idea for a simple and potentially profitable trading system lies waiting in the midst of the everyday technical tools and screens you rely on every day. All you need is a little imagination and the courage to intelligently develop the concept. |
| Graphic provided by: MetaStock. |
| Graphic provided by: CS Scientific expert from MetaStock 11. |
| |
| The nice thing? It is completely mechanical and objective in nature, with no second-guessing. You get a close beneath either stop and you're out of at least one half of the position until you're flat once again. Simple, and from the looks of it, it works on a lot of different stocks, ETFs, and futures contracts. |

|
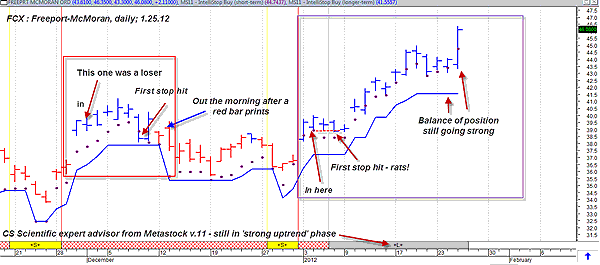
| FIGURE 2: FCX, DAILY. The same basic method can easily be applied to stocks, too. Here we see the system at work in shares of Freeport-McMoran on a daily time frame chart. |
| Graphic provided by: MetaStock. |
| Graphic provided by: CS Scientific expert from MetaStock 11. |
| |
| Now, of course, there are ways to improve upon this method. For example, you could use this as a basic market-timing template, perhaps using the short-term stop as a guide to help you stay on the right side of the market for your short-term stock swing trades (which could also use the same basic method to trigger entries and exits) and the longer-term stop to help you stay in, say, value or dividend-paying stocks or even covered-call positions. See Figure 2. The possibilities are endless, and all you need is a bit of creativity and foresight on how to best apply this very useful MetaStock template to your own trading regimen. |
Donald W. Pendergast is a financial markets consultant who offers specialized services to stock brokers and high net worth individuals who seek a better bottom line for their portfolios.
| Title: | Writer, market consultant |
| Company: | Linear Trading Systems LLC |
| Jacksonville, FL 32217 | |
| Phone # for sales: | 904-239-9564 |
| E-mail address: | lineartradingsys@gmail.com |
Traders' Resource Links | |
| Linear Trading Systems LLC has not added any product or service information to TRADERS' RESOURCE. | |
Click here for more information about our publications!
Comments

Request Information From Our Sponsors
- StockCharts.com, Inc.
- Candle Patterns
- Candlestick Charting Explained
- Intermarket Technical Analysis
- John Murphy on Chart Analysis
- John Murphy's Chart Pattern Recognition
- John Murphy's Market Message
- MurphyExplainsMarketAnalysis-Intermarket Analysis
- MurphyExplainsMarketAnalysis-Visual Analysis
- StockCharts.com
- Technical Analysis of the Financial Markets
- The Visual Investor
- VectorVest, Inc.
- Executive Premier Workshop
- One-Day Options Course
- OptionsPro
- Retirement Income Workshop
- Sure-Fire Trading Systems (VectorVest, Inc.)
- Trading as a Business Workshop
- VectorVest 7 EOD
- VectorVest 7 RealTime/IntraDay
- VectorVest AutoTester
- VectorVest Educational Services
- VectorVest OnLine
- VectorVest Options Analyzer
- VectorVest ProGraphics v6.0
- VectorVest ProTrader 7
- VectorVest RealTime Derby Tool
- VectorVest Simulator
- VectorVest Variator
- VectorVest Watchdog
