HOT TOPICS LIST
- MACD
- Fibonacci
- RSI
- Gann
- ADXR
- Stochastics
- Volume
- Triangles
- Futures
- Cycles
- Volatility
- ZIGZAG
- MESA
- Retracement
- Aroon
INDICATORS LIST
LIST OF TOPICS
PRINT THIS ARTICLE
by Chaitali Mohile
The breakout journey of General Electric is likely to tumble.
Position: N/A
Chaitali Mohile
Active trader in the Indian stock markets since 2003 and a full-time writer. Trading is largely based upon technical analysis.
PRINT THIS ARTICLE
BREAKOUTS
GE Bullish Breakout
01/31/12 11:05:33 AMby Chaitali Mohile
The breakout journey of General Electric is likely to tumble.
Position: N/A
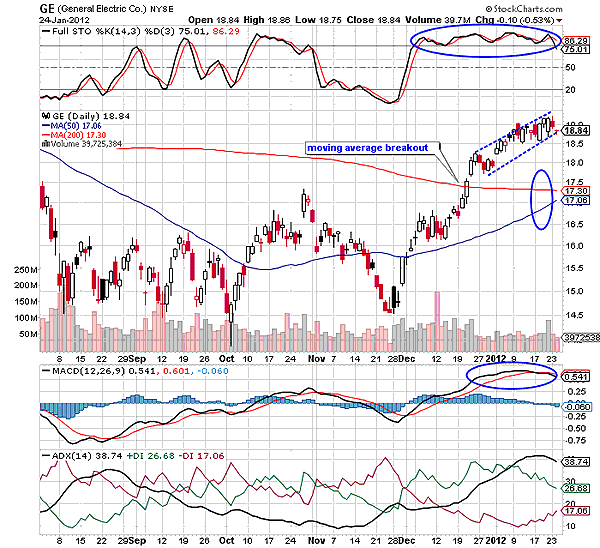
| After prices broke above the 200-day moving average (MA) General Electric (GE) has moved vertically upward. Though the rally had been initiated much earlier, the MA breakout induced high bullish interest. The full stochastic (14,3,3) slipped into an overbought zone, and the moving average convergence/divergence (MACD) (12,26,9) surged in positive territory. The jittery average directional index (ADX) (14) moved above 20 levels, developing a fresh uptrend during the breakout. The stability of the fresh breakout rally was confirmed by the encouraging volume. Everything together strengthened the new bullish rally. Gradually, price surged to the higher levels. However, the price action was not smooth. We can see in Figure 1 that GE has formed a very short-term rising wedge formation during its upward journey. The bearish candles and doji candlesticks reflected high volatility and negative pressure in the rally. |

|
| FIGURE 1: GE, DAILY |
| Graphic provided by: StockCharts.com. |
| |
| In the meantime, the ADX (14) reached 40 levels, the gap between the MACD line and trigger line had vanished, and the highly overbought stochastic oscillator showed reluctance to travel in the same area. Thus, an overheated uptrend, negative MACD (12,26,9), and the extremely bullish oscillator are reflecting a bearish reversal possibility for GE. In Figure 1, the rising wedge is ready to break down in forthcoming sessions. This bearish breakout would be very short term, as the 200-day MA is the robust support for the stock. Since the indicators have not begun descending, the stock could surge a few more points before actually breaking down. The converging 200-day MA and the 50-day MA are likely to show bullish moving average crossover in the near future. This crossover would protect the bullish sentiments as the potential descending rally would get strong support. |
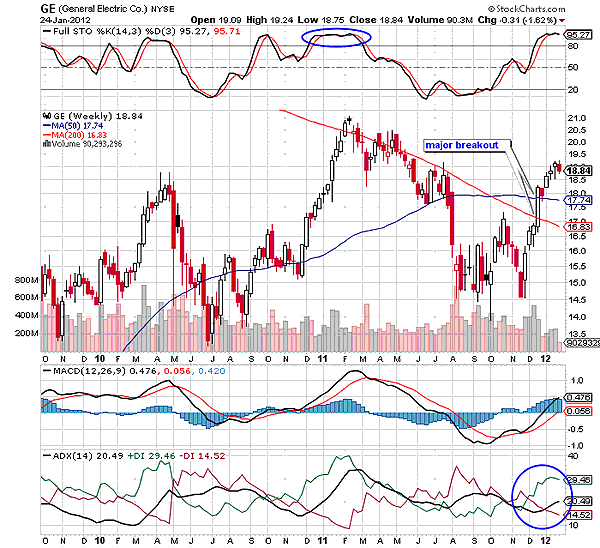
| The sharply descending 200-day MA dragged down the price, terminating the ongoing bullish rally in Figure 2. The long-term MA met with resistance, but the stock continued to fall under the bearish pressure. The stock underwent the corrective phase for almost nine to 10 months. Eventually, a pullback rally was initiated in December 2011. The long bullish candles converted moving average resistances to support and surged higher, a major bullish breakout for GE. But as the price climbed, the candles shrank, suggesting an upcoming weakness in the rally. A hanging man candlestick pattern was formed in Figure 2. This pattern terminates the existing bullish rally, initiating new downward move. |

|
| FIGURE 2: GE, WEEKLY |
| Graphic provided by: StockCharts.com. |
| |
| In Figure 2, the hanging man pattern is likely to pull the price towards its immediate 50-day MA support. The buying pressure (green line) is declining, affecting the developing uptrend. The ADX (14) had recently touched the 20 levels, but the reversing buying pressure would weaken the trend. An overbought stochastic oscillator is likely to plunge as it has never sustained in this area for a long time. |
| Thus, GE is likely to trigger a short-term bearish rally in such a scenario. |
Active trader in the Indian stock markets since 2003 and a full-time writer. Trading is largely based upon technical analysis.
| Company: | Independent |
| Address: | C1/3 Parth Indraprasth Towers. Vastrapur |
| Ahmedabad, Guj 380015 | |
| E-mail address: | chaitalimohile@yahoo.co.in |
Traders' Resource Links | |
| Independent has not added any product or service information to TRADERS' RESOURCE. | |
Click here for more information about our publications!
PRINT THIS ARTICLE

Request Information From Our Sponsors
- StockCharts.com, Inc.
- Candle Patterns
- Candlestick Charting Explained
- Intermarket Technical Analysis
- John Murphy on Chart Analysis
- John Murphy's Chart Pattern Recognition
- John Murphy's Market Message
- MurphyExplainsMarketAnalysis-Intermarket Analysis
- MurphyExplainsMarketAnalysis-Visual Analysis
- StockCharts.com
- Technical Analysis of the Financial Markets
- The Visual Investor
- VectorVest, Inc.
- Executive Premier Workshop
- One-Day Options Course
- OptionsPro
- Retirement Income Workshop
- Sure-Fire Trading Systems (VectorVest, Inc.)
- Trading as a Business Workshop
- VectorVest 7 EOD
- VectorVest 7 RealTime/IntraDay
- VectorVest AutoTester
- VectorVest Educational Services
- VectorVest OnLine
- VectorVest Options Analyzer
- VectorVest ProGraphics v6.0
- VectorVest ProTrader 7
- VectorVest RealTime Derby Tool
- VectorVest Simulator
- VectorVest Variator
- VectorVest Watchdog
