HOT TOPICS LIST
- MACD
- Fibonacci
- RSI
- Gann
- ADXR
- Stochastics
- Volume
- Triangles
- Futures
- Cycles
- Volatility
- ZIGZAG
- MESA
- Retracement
- Aroon
INDICATORS LIST
LIST OF TOPICS
PRINT THIS ARTICLE
by Koos van der Merwe
A flag and pennant pattern formation is a true consolidation pattern and a very reliable indicator.
Position: Accumulate
Koos van der Merwe
Has been a technical analyst since 1969, and has worked as a futures and options trader with First Financial Futures in Johannesburg, South Africa.
PRINT THIS ARTICLE
FLAGS AND PENNANTS
A Flag For GLD
01/27/12 09:17:47 AMby Koos van der Merwe
A flag and pennant pattern formation is a true consolidation pattern and a very reliable indicator.
Position: Accumulate
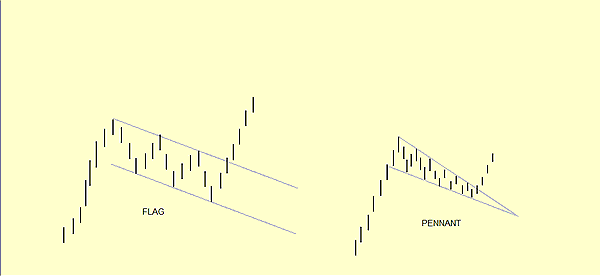
| In a rising bull market, flags and pennants usually form after a dynamic nearly straight move up, usually on heavy volume. Prices react on lower volume with a series of minor fluctuations. With a flag formation, this usually results in a downsloping compact parallelogram. With a pennant, however, the prices are bounded by converging lines rather than by parallel lines. In order to be considered valid, a flag and pennant pattern should conform to three rules: 1. They should develop after a very large up or down move 2. Volume should decline during the formation of the pattern 3. Prices should break out of the pattern in a matter of weeks. |

|
| FIGURE 1: FLAG AND PENNANT PATTERNS |
| Graphic provided by: AdvancedGET. |
| |
| Figure 1 shows the basic patterns of both the flag and the pennant. |

|
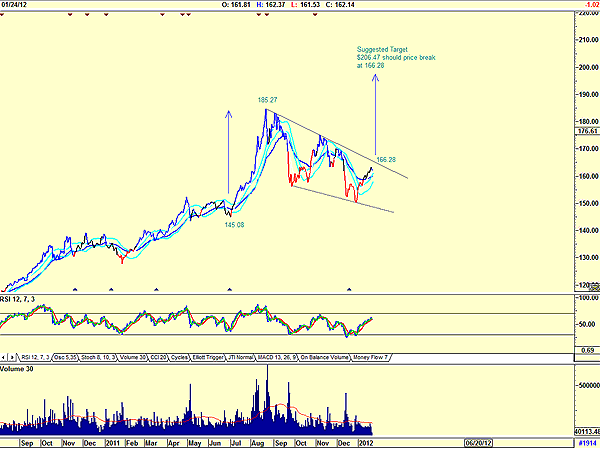
| FIGURE 2: STREET TRACKS GOLD WITH FLAG PATTERN DEVELOPING |
| Graphic provided by: AdvancedGET. |
| |
| On the chart of the StreetTracks Gold share shown in Figure 2, you see the formation of a flag pattern. Note the target price suggested by the measuring formula of the flag, should the price break above $166.28. The measuring formulas for flags and pennants are identical. You simply add the length of the pole formed in the move, leading the pattern to the point where the price breaks above the downtrending line of the pattern. Keep an eye on the volume and look for a sudden increase in volume to confirm a breakout. StreetTracks Gold is an exchange traded fund that can be watched and bought once the price breaks above the upper trendline. |
Has been a technical analyst since 1969, and has worked as a futures and options trader with First Financial Futures in Johannesburg, South Africa.
| Address: | 3256 West 24th Ave |
| Vancouver, BC | |
| Phone # for sales: | 6042634214 |
| E-mail address: | petroosp@gmail.com |
Click here for more information about our publications!
Comments

Request Information From Our Sponsors
- StockCharts.com, Inc.
- Candle Patterns
- Candlestick Charting Explained
- Intermarket Technical Analysis
- John Murphy on Chart Analysis
- John Murphy's Chart Pattern Recognition
- John Murphy's Market Message
- MurphyExplainsMarketAnalysis-Intermarket Analysis
- MurphyExplainsMarketAnalysis-Visual Analysis
- StockCharts.com
- Technical Analysis of the Financial Markets
- The Visual Investor
- VectorVest, Inc.
- Executive Premier Workshop
- One-Day Options Course
- OptionsPro
- Retirement Income Workshop
- Sure-Fire Trading Systems (VectorVest, Inc.)
- Trading as a Business Workshop
- VectorVest 7 EOD
- VectorVest 7 RealTime/IntraDay
- VectorVest AutoTester
- VectorVest Educational Services
- VectorVest OnLine
- VectorVest Options Analyzer
- VectorVest ProGraphics v6.0
- VectorVest ProTrader 7
- VectorVest RealTime Derby Tool
- VectorVest Simulator
- VectorVest Variator
- VectorVest Watchdog
