HOT TOPICS LIST
- MACD
- Fibonacci
- RSI
- Gann
- ADXR
- Stochastics
- Volume
- Triangles
- Futures
- Cycles
- Volatility
- ZIGZAG
- MESA
- Retracement
- Aroon
INDICATORS LIST
LIST OF TOPICS
PRINT THIS ARTICLE
by Billy Williams
Price movement is king when it comes to spotting trends, but you have to be able to see the forest from the trees to time your entries successfully.
Position: Sell
Billy Williams
Billy Williams has been trading the markets for 27 years, specializing in momentum trading with stocks and options.
PRINT THIS ARTICLE
TECHNICAL ANALYSIS
Dominant Trend Identification & Timing
01/25/12 11:48:52 AMby Billy Williams
Price movement is king when it comes to spotting trends, but you have to be able to see the forest from the trees to time your entries successfully.
Position: Sell
| Price movement relates to the movement of price in a definitive direction, whereas price action is the simple observation of what price has done and how it is acting at the present. To get an entry setup in your crosshairs, price movement is the more narrow consideration of these two distant cousins, and the one that will reveal which direction the stock's strength is moving or trending. Upward price movements are identified by a series of higher price highs and higher price lows as price trades like the ocean tide, moving in and out with great predictability. Likewise, downward price movements are identified by a series of lower price highs and lower price lows as the price movement noticeably descends in value. |
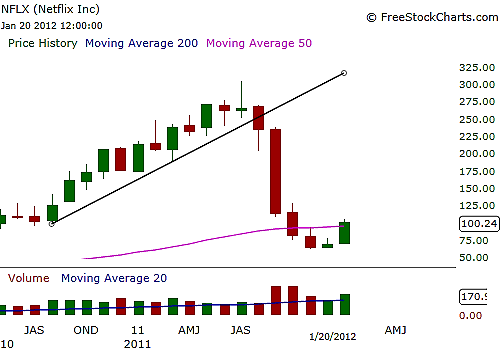
| When price fails to follow through in a steady direction and this movement is violated by price, then a trend reversal is in play where price movement may shift in the opposite direction. All trends are a form of price movement, but there are key traits that allow you to look beyond the surface of buying and selling. Such traits allow you to get a better look at a stock's trend to gauge its strength and ability to follow through with momentum. See Figure 1. |

|
| FIGURE 1: NFLX. On the monthly chart, you can see that NFLX was on a steady bullish run for all of 2010 and mid-2011 until its uptrend line was broken, signaling a price reversal. |
| Graphic provided by: www.freestockcharts.com. |
| |
| When price moves from a trending period (expansion) to a trading range (contraction), where support and resistance are clearly identifiable, there also exists the potential for price to form a chart pattern such as the flat base or other recognizable pattern, depending on a combination of trade volume and psychology depending on the context of the market and the traders involved. It is within these moments of contraction that the potential for profitable trading exist, especially in order to enter the dominant trend. In order to identify the dominant trend, you have to understand how to use the three trends in any given time. They are the short-term trend, the intermediate-term trend, and the long-term trend. The short-term trend is typically measured in the time period between minutes and a couple of days, the intermediate-term trend is measured from a few days to a couple of months, and the long-term trend is measured from a couple of months to as long as several years. |

|
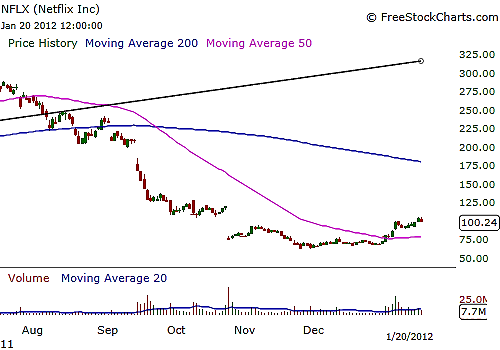
| FIGURE 2: NFLX. By scaling down to a smaller trend, you can see where the trendline was broken as well as the lower price highs and lower price lows that followed. Each pullback represents a short entry as the bears took control of the stock, forcing its price lower. |
| Graphic provided by: www.freestockcharts.com. |
| |
| Next, you must be able to see the forest from the trees and vice versa in order to use the larger period time frames to identify the dominant direction of the market and scale down to the next smaller time frame in order to time your trade. By using the next-up larger trend, you can eliminate a lot of the volatile price action and take advantage of the smoother path that price tends to reflect while scaling down when timing an entry to a scale that is closer to the action and exploiting it with better entries while being mindful of the dominant trend at play. See Figure 2. |
| Patterns at either end of the spectrum -- larger trend to smaller trend -- are helpful. For example, if a pattern has formed or is forming on an intermediate-term trend, then scaling down to the short-term trend allows you to spot periods of contraction where you can enter in the anticipation that a breakout is on the horizon. Using price movement in this way gives you a roadmap to the future direction of a move, allowing you to time your entries with greater precision and, more important, grow in confidence as your ability to identify the bigger picture as the dominant trend becomes clearer to you. |
Billy Williams has been trading the markets for 27 years, specializing in momentum trading with stocks and options.
| Company: | StockOptionSystem.com |
| E-mail address: | stockoptionsystem.com@gmail.com |
Traders' Resource Links | |
| StockOptionSystem.com has not added any product or service information to TRADERS' RESOURCE. | |
Click here for more information about our publications!
Comments

Request Information From Our Sponsors
- StockCharts.com, Inc.
- Candle Patterns
- Candlestick Charting Explained
- Intermarket Technical Analysis
- John Murphy on Chart Analysis
- John Murphy's Chart Pattern Recognition
- John Murphy's Market Message
- MurphyExplainsMarketAnalysis-Intermarket Analysis
- MurphyExplainsMarketAnalysis-Visual Analysis
- StockCharts.com
- Technical Analysis of the Financial Markets
- The Visual Investor
- VectorVest, Inc.
- Executive Premier Workshop
- One-Day Options Course
- OptionsPro
- Retirement Income Workshop
- Sure-Fire Trading Systems (VectorVest, Inc.)
- Trading as a Business Workshop
- VectorVest 7 EOD
- VectorVest 7 RealTime/IntraDay
- VectorVest AutoTester
- VectorVest Educational Services
- VectorVest OnLine
- VectorVest Options Analyzer
- VectorVest ProGraphics v6.0
- VectorVest ProTrader 7
- VectorVest RealTime Derby Tool
- VectorVest Simulator
- VectorVest Variator
- VectorVest Watchdog
