HOT TOPICS LIST
- MACD
- Fibonacci
- RSI
- Gann
- ADXR
- Stochastics
- Volume
- Triangles
- Futures
- Cycles
- Volatility
- ZIGZAG
- MESA
- Retracement
- Aroon
INDICATORS LIST
LIST OF TOPICS
PRINT THIS ARTICLE
by Koos van der Merwe
Triangles tend to act as periods of consolidation from which prices continue in the same direction.
Position: Buy
Koos van der Merwe
Has been a technical analyst since 1969, and has worked as a futures and options trader with First Financial Futures in Johannesburg, South Africa.
PRINT THIS ARTICLE
TRIANGLES
Those Triangles And How They Form
01/24/12 08:49:54 AMby Koos van der Merwe
Triangles tend to act as periods of consolidation from which prices continue in the same direction.
Position: Buy
| Triangles form as a result of indecision on the part of both buyers and sellers. During this time, market participants tend to withdraw to the sidelines, resulting in narrower market fluctuations and diminishing volume. A breakout from a triangle usually occurs as the result of some news affecting either the company behind the share or the market generally. If legitimate, the breakout is usually accompanied by an increase in volume. |

|
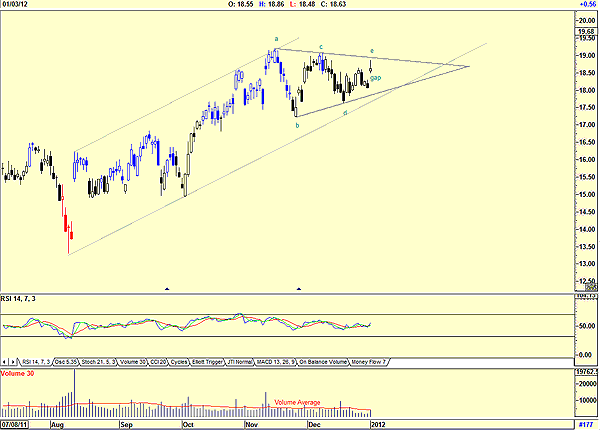
| FIGURE 1: CISCO SYSTEMS SHOWING FORMATION OF A TRIANGLE |
| Graphic provided by: AdvancedGET. |
| |
| Figure 1 is a daily chart of Cisco Systems (CSCO). The chart shows the formation of a triangle. The fact that the price has risen on a gap suggests that the upper band could be tested and possibly broken. This looks very possible, because it would be on "e," the third top. Volume is starting to increase and is currently testing the average, a 30-period moving average. A negative is the relative strength index (RSI), which is trending down. |

|
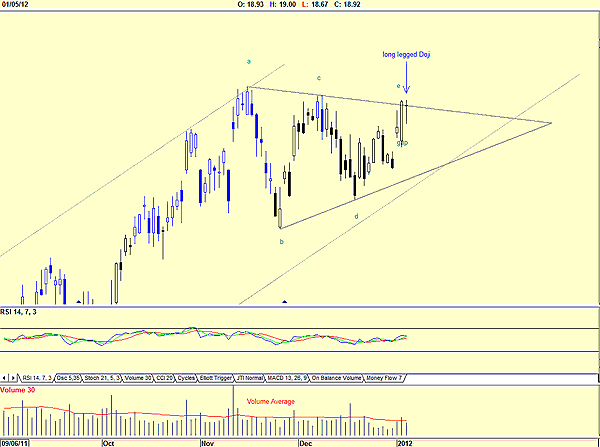
| FIGURE 2: DOJI CANDLESTICK |
| Graphic provided by: AdvancedGET. |
| |
| Figure 2 shows how the price rose strongly and broke through the upper triangle trendline. Volume also rose above the 30-period moving average, suggesting strength, but the following day, a candlestick long-legged doji formed, with falling volume. This type of doji is used as a signal to indicate indecision in the market at the tops and may lead to a reversal in the trend. With the falling volume and a negative trending RSI, this looks indeed possible. |

|
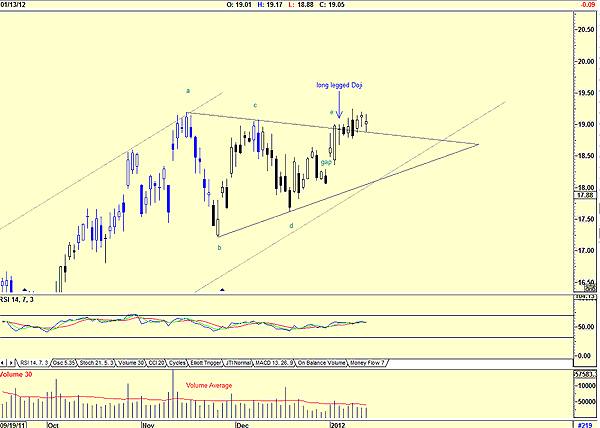
| FIGURE 3: TEST AND RETEST OF THE UPPER TRENDLINE |
| Graphic provided by: AdvancedGET. |
| |
| Figure 3 shows the indecision, with the price breaking above the upper triangle line a positive sign, continually testing and retesting the trendline. Volume is below average, suggesting that indecision is still present. By all accounts, the price should fall to fill the gap, but the upper triangle trendline appears to be preventing that. A speculator could consider nibbling at the share whenever the price tests the upper trendline. |

|
| FIGURE 4: FORMATION OF A TRIANGLE SUGGESTING A BUY SIGNAL AND POSSIBLE TARGETS |
| Graphic provided by: AdvancedGET. |
| |
| Figure 4 shows that the price started to move up strongly with a small increase in volume and a rise in the RSI. To determine how high the share price could rise, we can calculate a triangle target. This suggests that the price could rise to $23.14 (19.25 - 13.32 = 5.93 + 17.21 = 23.14). To confirm this target, I added a Fibonacci extension drawn from the low of $13.32 to $19.25 and extended from $17.21. This suggests a target of $20.16 (50% extension) and $20.85 (61.8% extension). The 100% extension suggests a target of $23.09, very close to the triangle target of $23.14. Volume did rise above the moving average as the price rose but then fell below the moving average, suggesting possible weakness. The RSI is retesting the 72 overbought level, but has not penetrated it. I would be a buyer of Cisco Systems on any correction. |
Has been a technical analyst since 1969, and has worked as a futures and options trader with First Financial Futures in Johannesburg, South Africa.
| Address: | 3256 West 24th Ave |
| Vancouver, BC | |
| Phone # for sales: | 6042634214 |
| E-mail address: | petroosp@gmail.com |
Click here for more information about our publications!
PRINT THIS ARTICLE

|

Request Information From Our Sponsors
- VectorVest, Inc.
- Executive Premier Workshop
- One-Day Options Course
- OptionsPro
- Retirement Income Workshop
- Sure-Fire Trading Systems (VectorVest, Inc.)
- Trading as a Business Workshop
- VectorVest 7 EOD
- VectorVest 7 RealTime/IntraDay
- VectorVest AutoTester
- VectorVest Educational Services
- VectorVest OnLine
- VectorVest Options Analyzer
- VectorVest ProGraphics v6.0
- VectorVest ProTrader 7
- VectorVest RealTime Derby Tool
- VectorVest Simulator
- VectorVest Variator
- VectorVest Watchdog
- StockCharts.com, Inc.
- Candle Patterns
- Candlestick Charting Explained
- Intermarket Technical Analysis
- John Murphy on Chart Analysis
- John Murphy's Chart Pattern Recognition
- John Murphy's Market Message
- MurphyExplainsMarketAnalysis-Intermarket Analysis
- MurphyExplainsMarketAnalysis-Visual Analysis
- StockCharts.com
- Technical Analysis of the Financial Markets
- The Visual Investor
