HOT TOPICS LIST
- MACD
- Fibonacci
- RSI
- Gann
- ADXR
- Stochastics
- Volume
- Triangles
- Futures
- Cycles
- Volatility
- ZIGZAG
- MESA
- Retracement
- Aroon
INDICATORS LIST
LIST OF TOPICS
PRINT THIS ARTICLE
by Koos van der Merwe
We all know that when a gap forms the share price more often than not rises or falls to fill that gap. Right? Check out Lululemon.
Position: Sell
Koos van der Merwe
Has been a technical analyst since 1969, and has worked as a futures and options trader with First Financial Futures in Johannesburg, South Africa.
PRINT THIS ARTICLE
GAPS
Island Reversal For Lululemon
01/23/12 09:00:38 AMby Koos van der Merwe
We all know that when a gap forms the share price more often than not rises or falls to fill that gap. Right? Check out Lululemon.
Position: Sell
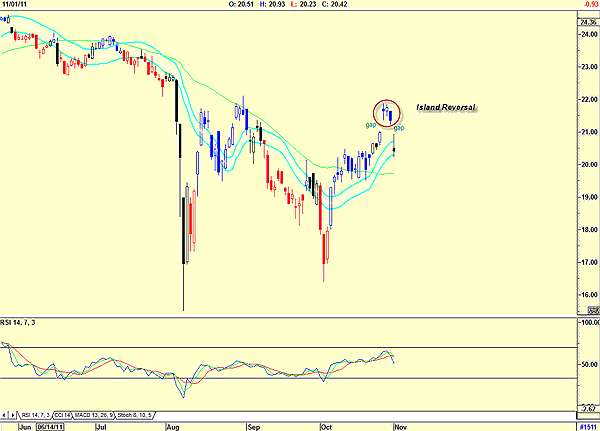
| An island reversal consists of a breakaway gap followed by an exhaustion gap caused by a price pullback to fill the original gap. Usually the time period before the pullback is one to three, even four days. Should the time period take longer than that time period, or if the price rises to fill the gap without a gap forming in that pullback, then the pattern is no longer called an island reversal. Of course, should the price be falling, then the original gap is known as an exhaustion gap, and the recovery gap is known as a breakaway gap. |

|
| FIGURE 1: CLASSIC ISLAND REVERSAL |
| Graphic provided by: AdvancedGET. |
| |
| Figure 1 shows the share price gapping up in price, after three days gapping down forming an island reversal. We should therefore expect the stock price to fall to even lower levels. This is not confirmed by the relative strength index (RSI), which has not given a sell signal, but it is still in a bullish trend. Let us see what happened. |

|
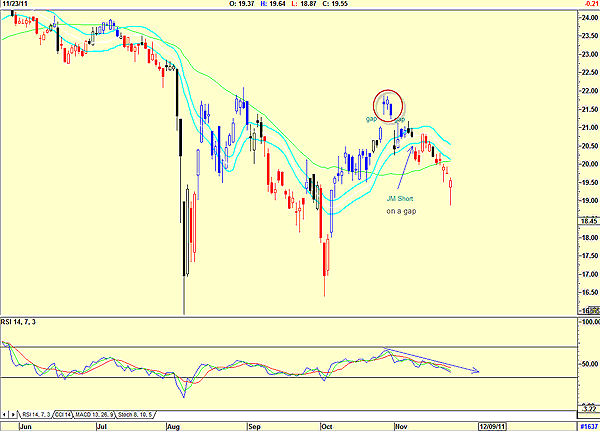
| FIGURE 2: SHOWING THE FALL IN PRICE AFTER AN ISLAND REVERSAL |
| Graphic provided by: AdvancedGET. |
| |
| Figure 2 shows how the price fell away on another gap, giving a JM internal band sell signal. The price then rose but did not give a buy signal by breaking above the upper band. (A JM internal band is a 15-period simple moving average offset by 2% positive and 2% negative.) Now, knowing what an island reversal is, can we say that an island reversal is developing on the stock price of Lululemon. Let us study Figure 3. |

|
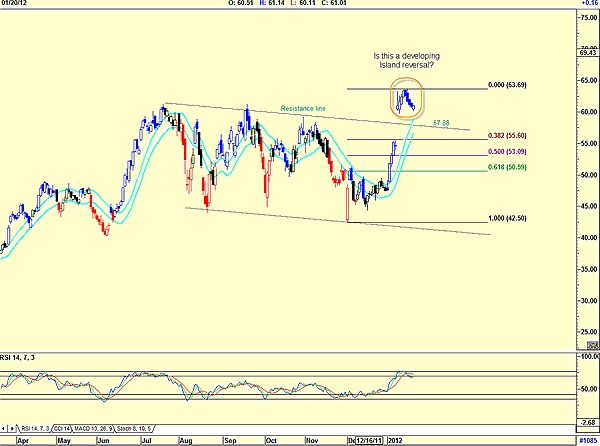
| FIGURE 3: IS AN ISLAND REVERSAL FORMING? |
| Graphic provided by: AdvancedGET. |
| |
| Figure 3 shows how the price gapped up strongly when the company announced better financial results than the market forecast. The price moved higher for the following three days, then started to fall back to fill the gap as expected. The price could gradually drift lower to fill the gap and find support on the resistance line in the region of $57.88. This is suggested by the RSI, which has given a sell signal. Or the price could fall on a gap forming an island reversal, which means that the support at $57.88 will be weak, and the share price would fall even lower. To get an idea of how low it could fall, I have drawn in Fibonacci retracement levels. Lululemon, a company much loved by yoga enthusiasts throughout North America and Canada, looks as though it will weaken over the coming months. However, we can continue to watch the stock to see what actually happens and make a decision at that time. |
Has been a technical analyst since 1969, and has worked as a futures and options trader with First Financial Futures in Johannesburg, South Africa.
| Address: | 3256 West 24th Ave |
| Vancouver, BC | |
| Phone # for sales: | 6042634214 |
| E-mail address: | petroosp@gmail.com |
Click here for more information about our publications!
Comments

Request Information From Our Sponsors
- StockCharts.com, Inc.
- Candle Patterns
- Candlestick Charting Explained
- Intermarket Technical Analysis
- John Murphy on Chart Analysis
- John Murphy's Chart Pattern Recognition
- John Murphy's Market Message
- MurphyExplainsMarketAnalysis-Intermarket Analysis
- MurphyExplainsMarketAnalysis-Visual Analysis
- StockCharts.com
- Technical Analysis of the Financial Markets
- The Visual Investor
- VectorVest, Inc.
- Executive Premier Workshop
- One-Day Options Course
- OptionsPro
- Retirement Income Workshop
- Sure-Fire Trading Systems (VectorVest, Inc.)
- Trading as a Business Workshop
- VectorVest 7 EOD
- VectorVest 7 RealTime/IntraDay
- VectorVest AutoTester
- VectorVest Educational Services
- VectorVest OnLine
- VectorVest Options Analyzer
- VectorVest ProGraphics v6.0
- VectorVest ProTrader 7
- VectorVest RealTime Derby Tool
- VectorVest Simulator
- VectorVest Variator
- VectorVest Watchdog
