HOT TOPICS LIST
- MACD
- Fibonacci
- RSI
- Gann
- ADXR
- Stochastics
- Volume
- Triangles
- Futures
- Cycles
- Volatility
- ZIGZAG
- MESA
- Retracement
- Aroon
INDICATORS LIST
LIST OF TOPICS
PRINT THIS ARTICLE
by Billy Williams
In poker, you play the other players, not your hand. In trading, you trade against other traders by being able to see what their hand is through price patterns.
Position: Hold
Billy Williams
Billy Williams has been trading the markets for 27 years, specializing in momentum trading with stocks and options.
PRINT THIS ARTICLE
TRIANGLES
Price Patterns, Psychology, And Trading Success
01/20/12 10:06:33 AMby Billy Williams
In poker, you play the other players, not your hand. In trading, you trade against other traders by being able to see what their hand is through price patterns.
Position: Hold
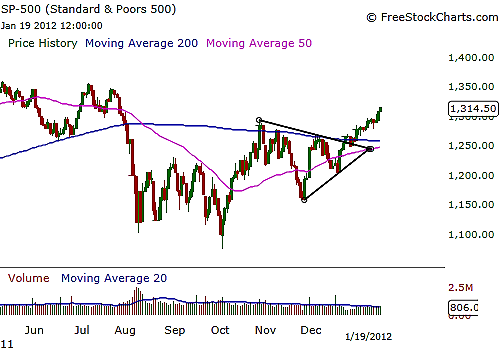
| The market experiences a number of opposing forces each day as a result of buying and selling, price expansion and contraction, which forms the basis for price action. All price action is movement and, more important, a reflection on both the temperament and emotions experienced by the traders that make up those markets, the result of which is noticeable patterns that can be traded successfully. While some traders argue that these patterns are only noticeable in hindsight after they have formed and price has already made its move in a given direction, the reality is that by training yourself to spot these formations gives you a strong competitive edge against other traders who dismiss them outright due to not understanding them. It's important to stress that understanding the psychology behind the pattern's formation as well as the compelling technical factors that make it up is where the strong edge lies for the skilled speculator. See Figure 1. |

|
| FIGURE 1: S&P 500. The SPX has been experiencing a period of tight price contraction, where it formed a bullish pennant pattern as the bulls took control of price, forcing it higher. |
| Graphic provided by: www.freestockcharts.com. |
| |
| The reason for this is that most traders who make up the market for a stock or any other security tend to move in herds. These herds make up the bulk of the trading volume on a given stock and, as human nature shows, they tend to affect each other's judgment during moments of extreme volatility. This is important to you because during these moments of volatility, emotions are high and otherwise intelligent people don't necessarily make the most rational of investment decisions and end up making foolish decisions at the worst possible time. Specifically, price is a series of ups and downs where the given trend transitions from bullish to bearish, but it is during the period of transition where price patterns emerge and where the opportunity lies for the technician who understands where and what to look for. |

|
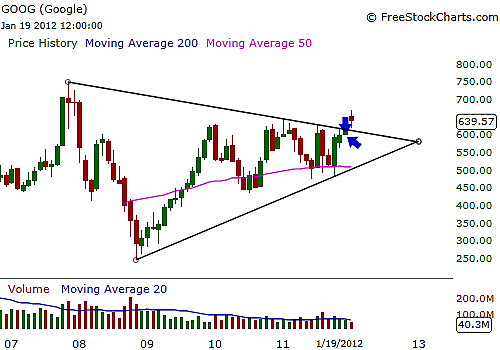
| FIGURE 2: GOOGLE. On the five-year chart, Google formed a bullish triangle, which took years to form. The ability to spot a pattern like this gives you an edge on a smaller time frame because you can gain an understanding of what price is leading up to, which in this case is a breakout above the upper trendline. |
| Graphic provided by: www.freestockcharts.com. |
| |
| For example, if price has had a big runup to the upside but then pulls back, most traders get scared that price is about to reverse and begin to sell off their positions, while others are confident that the stock will resume its upward move. As the stock begins to trade, some traders who sold off their positions worry that the stock will begin its upward ascent and start buying into the stock, while other traders who sat tight continue to hold firm. The result is that price begins its upward move but can't quite muster the necessary strength to trade past the old high and traders begin to liquidate some of their positions, forcing the stock to start declining again. However, there is enough support lingering near the former price low, with more traders willing to buy shares because they determine the shares as more valuable at the current price level and forces the stock to go up. Only now, there is even weaker enthusiasm for a possible bull run than the previous ascent and price doesn't quite make it to the previous price high, meeting with more traders selling off their shares. See Figure 2. |
| This back-and-forth motion due to trading psychology and the lack of enthusiasm on the part of the bulls to take control of the stock's trend leads to the formation of a bullish triangle pattern. It is only as price contracts within such a tight range as volume declines steadily that the stock finds itself at the apex of the pattern where traders who had been sitting on the sidelines waiting for signs of a potential trend resumption begin to buy shares. As volume begins to swell and rise, the stock explodes through the pattern's upper trendline into a bull run. |
| Even if you had not timed the pattern for an effective entry at the moment of the breakout, if you had at least been skilled enough to see what was going on, you could time an entry into a price pullback or other pause within the stock's price action to exploit the move profitably. In trading, price patterns reveal periods of contraction where trading ranges form and smart traders buy support and sell resistance while other patterns signal trend reversals such as the head & shoulders pattern, double-bottom/top, triple-bottom/top, and rising/falling wedges. The ability to decipher these patterns gives you insight into the bigger picture and if you have combination of skill, will, and the ability to control your risk, you can develop a much stronger edge in making winning trades over the other traders who readily dismiss these patterns without the benefit of understanding them. |
Billy Williams has been trading the markets for 27 years, specializing in momentum trading with stocks and options.
| Company: | StockOptionSystem.com |
| E-mail address: | stockoptionsystem.com@gmail.com |
Traders' Resource Links | |
| StockOptionSystem.com has not added any product or service information to TRADERS' RESOURCE. | |
Click here for more information about our publications!
PRINT THIS ARTICLE

Request Information From Our Sponsors
- VectorVest, Inc.
- Executive Premier Workshop
- One-Day Options Course
- OptionsPro
- Retirement Income Workshop
- Sure-Fire Trading Systems (VectorVest, Inc.)
- Trading as a Business Workshop
- VectorVest 7 EOD
- VectorVest 7 RealTime/IntraDay
- VectorVest AutoTester
- VectorVest Educational Services
- VectorVest OnLine
- VectorVest Options Analyzer
- VectorVest ProGraphics v6.0
- VectorVest ProTrader 7
- VectorVest RealTime Derby Tool
- VectorVest Simulator
- VectorVest Variator
- VectorVest Watchdog
- StockCharts.com, Inc.
- Candle Patterns
- Candlestick Charting Explained
- Intermarket Technical Analysis
- John Murphy on Chart Analysis
- John Murphy's Chart Pattern Recognition
- John Murphy's Market Message
- MurphyExplainsMarketAnalysis-Intermarket Analysis
- MurphyExplainsMarketAnalysis-Visual Analysis
- StockCharts.com
- Technical Analysis of the Financial Markets
- The Visual Investor
