HOT TOPICS LIST
- MACD
- Fibonacci
- RSI
- Gann
- ADXR
- Stochastics
- Volume
- Triangles
- Futures
- Cycles
- Volatility
- ZIGZAG
- MESA
- Retracement
- Aroon
INDICATORS LIST
LIST OF TOPICS
PRINT THIS ARTICLE
by Koos van der Merwe
A reader asked for further clarification of a double top or double bottom in a recent article about JP Morgan, especially what I did not consider a triangle formation.
Position: Buy
Koos van der Merwe
Has been a technical analyst since 1969, and has worked as a futures and options trader with First Financial Futures in Johannesburg, South Africa.
PRINT THIS ARTICLE
DOUBLE BOTTOMS
Talking Double Tops And Bottoms
01/20/12 02:56:58 PMby Koos van der Merwe
A reader asked for further clarification of a double top or double bottom in a recent article about JP Morgan, especially what I did not consider a triangle formation.
Position: Buy
| One way to tell if a trend has changed is to look whether a trendline is broken. A characteristic pattern starts to take shape on a chart and becomes a recognizable reversal pattern. The head & shoulders pattern and its inverse becomes recognizable, triggering a sell/buy when the price breaks the neckline. The next most identifiable pattern is the double-top or double-bottom formation. A double-top formation appears as an M on a chart and a double-bottom formation as a W. They are very popular formations, but they are more than often misinterpreted simply because each new wave up or down will appear to be forming a double top or bottom when in fact they are forming a triangle. Nine times out of 10, the trend will remain in force. The secret? A confirmation is only confirmed until the horizontal trendline from the middle correction of the M or W has been broken. |

|
| FIGURE 1: JPM, MAY 25, 2011 |
| Graphic provided by: AdvancedGET. |
| |
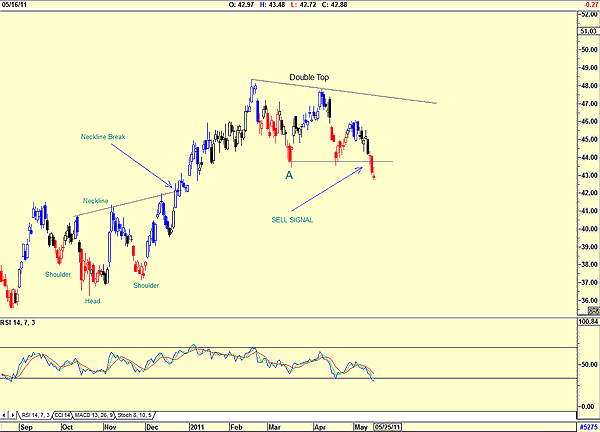
| In Figure 1, I show a chart of JP Morgan Chase (JPM) from August 2010 to May 2011. Note the inverse head & shoulders pattern that formed in October/November 2011 with a buy signal given when the price broke the neckline. In addition, note the double-top confirmation in April/May 2011 with a sell signal given when the price fell below the horizontal line drawn from the midpoint of the M formation at point A. |

|
| FIGURE 2: JPM, AUGUST 1, 2011 |
| Graphic provided by: AdvancedGET. |
| |
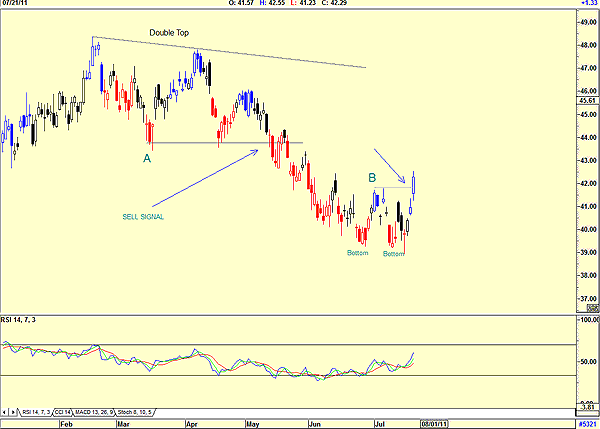
| In Figure 2, I have shown how the price fell to what appears to be a double bottom with a buy signal as the price broke above the horizontal line drawn from the center of the W formation. I did not consider this to be a true double-bottom formation, however, simply because of the size of the W formation. I have always preferred a far larger formation with investors/traders unsure of the trend. My uncertainty proved true, as the price dropped away. |

|
| FIGURE 3: JPM, JANUARY 18, 2012 |
| Graphic provided by: AdvancedGET. |
| |
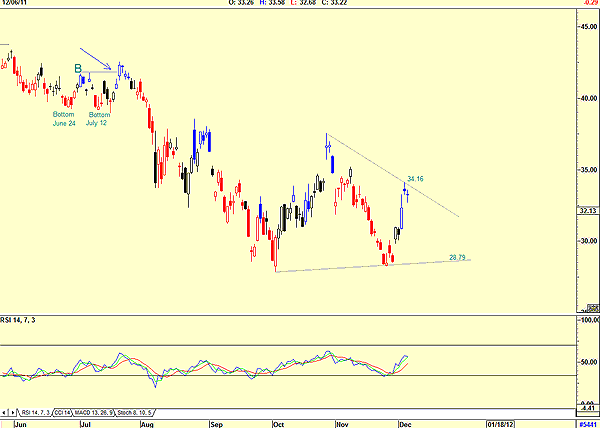
| Figure 3 suggests that a triangle could be developing, with the chances of a break below the lower trendline of the triangle at $28.79. What deterred me from accepting this pattern was the time taken for the pattern to develop. Triangles are periods of consolidation from which prices continue on in the same direction. During this time, market participants tend to withdraw to the sidelines, resulting in narrower market fluctuations and diminishing volume. The period of time taken for a triangle to form is also limited in time. Nevertheless, the possibility of the trend being a triangle at this point in time was considered, with a far lower price than $28.79 being in the cards. However, as the pattern developed, my analysis changed. |

|
| FIGURE 4: JPM, JANUARY 18, 2012 |
| Graphic provided by: AdvancedGET. |
| |
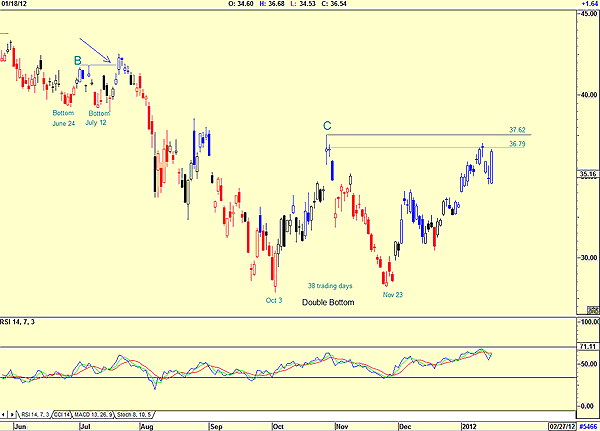
| So what makes me believe that a true double bottom has occurred now? First of all, look at the chart. The price broke above $34.16, the upper line of the triangle. Although this could still mean a fall in the price, what deterred me was the time taken for the pattern to develop. This was far greater than most triangles usually take. In addition, do note that the difference between the double bottom at C and the failed double bottom at B was that the share price took longer to form the double bottom. The time taken was from October 3 to November 23, 38 trading days, whereas the failed double bottom in Figure 2 was a much shorter time span, from June 24 to July 12, 13 trading days. I also cheated a little by drawing my horizontal line from the closing price at C (the lighter line), which was broken when the price tested it at $36.79. See Figure 4. Admittedly, there are many indicators out there that can give buy/sell signals far earlier that the patterns mentioned here, but the advantage of the pattern is that they can give us an idea of a target price that the share could rise/fall to. The difference between the price at the horizontal and the low reached added to the price of the horizontal. This may not be 100% accurate, but it does give us a good guesstimate. |
Has been a technical analyst since 1969, and has worked as a futures and options trader with First Financial Futures in Johannesburg, South Africa.
| Address: | 3256 West 24th Ave |
| Vancouver, BC | |
| Phone # for sales: | 6042634214 |
| E-mail address: | petroosp@gmail.com |
Click here for more information about our publications!
PRINT THIS ARTICLE

Request Information From Our Sponsors
- StockCharts.com, Inc.
- Candle Patterns
- Candlestick Charting Explained
- Intermarket Technical Analysis
- John Murphy on Chart Analysis
- John Murphy's Chart Pattern Recognition
- John Murphy's Market Message
- MurphyExplainsMarketAnalysis-Intermarket Analysis
- MurphyExplainsMarketAnalysis-Visual Analysis
- StockCharts.com
- Technical Analysis of the Financial Markets
- The Visual Investor
- VectorVest, Inc.
- Executive Premier Workshop
- One-Day Options Course
- OptionsPro
- Retirement Income Workshop
- Sure-Fire Trading Systems (VectorVest, Inc.)
- Trading as a Business Workshop
- VectorVest 7 EOD
- VectorVest 7 RealTime/IntraDay
- VectorVest AutoTester
- VectorVest Educational Services
- VectorVest OnLine
- VectorVest Options Analyzer
- VectorVest ProGraphics v6.0
- VectorVest ProTrader 7
- VectorVest RealTime Derby Tool
- VectorVest Simulator
- VectorVest Variator
- VectorVest Watchdog
