HOT TOPICS LIST
- MACD
- Fibonacci
- RSI
- Gann
- ADXR
- Stochastics
- Volume
- Triangles
- Futures
- Cycles
- Volatility
- ZIGZAG
- MESA
- Retracement
- Aroon
INDICATORS LIST
LIST OF TOPICS
PRINT THIS ARTICLE
by David Penn
When the DJUA failed to break out, many component stocks fell fast.
Position: N/A
David Penn
Technical Writer for Technical Analysis of STOCKS & COMMODITIES magazine, Working-Money.com, and Traders.com Advantage.
PRINT THIS ARTICLE
DOUBLE BOTTOMS
Divergences
05/17/02 10:07:43 AMby David Penn
When the DJUA failed to break out, many component stocks fell fast.
Position: N/A
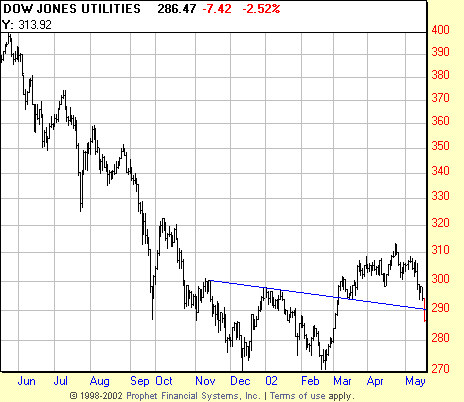
| My first article on the double bottom in the DJUA was in March of this year. At the time, the downtrend in the Average was still in place, but a strong countertrend rally appeared to represent a successful test of the mid-December 2001 bottom. I revisited the DJUA a month later in "Trends in Utilities" (Traders.com Advantage). Then, the DJUA had "broken out" from its double bottom, but was having a difficult time taking and holding higher ground. The DJUA peaked at 315 late in April- even forming a short-term head and shoulders top- and has since resumed its downtrend. As of this writing, the DJUA is back to 286, beneath the original breakout point of 294. |
| When I took a look in "Trends in Utilities" at some of the component stocks of the DJUA, one of the more interesting discoveries was the way many of the stocks were continuing to enjoy bull markets in spite of the difficulties in the DJUA. Stocks like PG&E Corporation (PCG) and Southern Company (SO) in particular were impressive. While the DJUA spent three months forming what looked like a double bottom, PCG advanced 22% from 18 to 22. SO moved up 11% from 23 to 25.5. This was not the entire story of big-time utilities stocks. Shares of Duke Energy (DUK) and American Electric Power (AEP) more or less mirrored the DJUA's struggles during the December 2001 to March 2002 time frame. DUK more or less broke even for the period, as did AEP (depending on where you measure, AEP lost). |

|
| Figure 1 DJUA: The breakout from this double bottom stopped short of its objective and corrected sharply. |
| Graphic provided by: WindowOnWallStreet.com. |
| Graphic provided by: ProphetFinance. |
| |
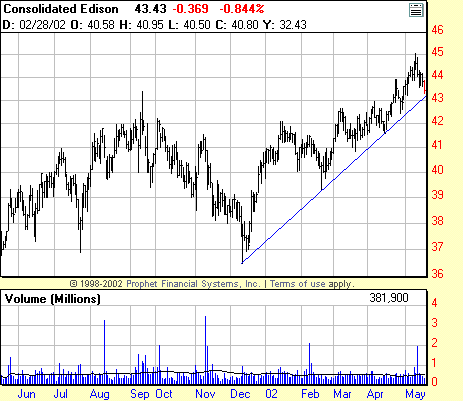
But the mystery surrounding the double bottom in the DJUA ("Chart Pattern Failures," Traders.com Advantage) now appears to be over, with a retracement that has taken prices back below both the original breakout point at 294, and the extended neckline at about 290. Bulkowski, in his "Encyclopedia of Chart Patterns," is so suspect of double bottom chart patterns that he encourages traders and investors to wait for successful tests of the neckline (a pullback that touches, but does not pierce, the area of the original breakout). Such caution would have been well-founded in the case of the double bottom in the DJUA, which now seems to be clearly signaling that is not ready for a prime-time breakout just yet. Figure 2. ED: An important trendline test looms for shares of Consolidated Edison. So how does this affect both the utilities stocks that were enjoying bull markets before the DJUA broke down, as well as those that were struggling alongside the Average? In the case of the latter group, stocks like PCG, the change was sharp and swift. Upward momentum had been fading in PCG, but the stock was making higher highs consistently in 2002 before the wheels fell off in mid-May. Consolidated Edison (ED) corrected sharply in February--at the same time as the second trough in the DJUA's double bottom. But shares of ED continued upward until mid-May. In fact, as the chart of ED shows, the stock has yet to break down beneath its five-month upward trendline. Unfortunately, this may not be the sign of strength that it appears presently. This is particularly so in the context of other utilities stocks. |
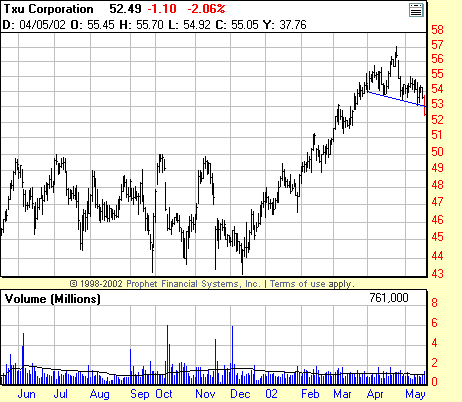
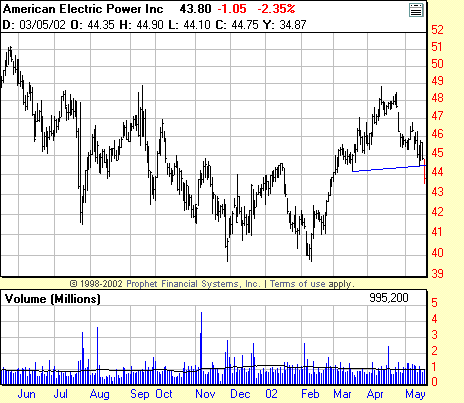
 Figure 3. TXU: Note the short term head and shoulders top at the end of this rally in TXU. Consider ED in comparison to the top that looks to be forming in TXU Corporation (TXU). TXU, like Consolidated Edison, enjoyed a strong bull market from mid-December 2001 until the end of April 2002, advancing almost 33%. However, TXU now looks strongly to have formed a downwardly tilting head and shoulders top, with the head coming at the mid-April peak. As of May 16th, TXU had just broken down beneath the neckline at 53 on above-average volume. What is alarming, from the point of view of ED longs, is how much TXU's advance and peak resembles that of ED. Another example of these utilities stocks breaking down is found in American Electric Power (AEP). AEP had not begun moving up as early as ED or TXU; AEP finally bottomed in early February (along with the second trough in the double bottom of the DJUA) and gained about 20% in just under three months. AEP also looks to have developed a head and shoulders top at its April peak. Like TXU, AEP has also broken down beneath the neckline as of mid-May. |
 Figure 4. AEP: An even larger head and shoulders top sits astride the spring rally of AEP. This demonstrates one of the more fundamental ways to look at indexes, such as the Dow Jones Utilities Average, by analyzing the effects the Average has on its components. Often, by doing so, an investor or trader can ferret out the stronger stocks that seem to be leading the index or Average and avoid those that are lagging. Conversely, when the index or Average is weakening, the trader alert to the various components of the Average can spot the weaker shares hiding among the stronger ones and consider selling those weaker stocks short. |
Technical Writer for Technical Analysis of STOCKS & COMMODITIES magazine, Working-Money.com, and Traders.com Advantage.
| Title: | Technical Writer |
| Company: | Technical Analysis, Inc. |
| Address: | 4757 California Avenue SW |
| Seattle, WA 98116 | |
| Phone # for sales: | 206 938 0570 |
| Fax: | 206 938 1307 |
| Website: | www.Traders.com |
| E-mail address: | DPenn@traders.com |
Traders' Resource Links | |
| Charting the Stock Market: The Wyckoff Method -- Books | |
| Working-Money.com -- Online Trading Services | |
| Traders.com Advantage -- Online Trading Services | |
| Technical Analysis of Stocks & Commodities -- Publications and Newsletters | |
| Working Money, at Working-Money.com -- Publications and Newsletters | |
| Traders.com Advantage -- Publications and Newsletters | |
| Professional Traders Starter Kit -- Software | |
Click here for more information about our publications!
PRINT THIS ARTICLE

Request Information From Our Sponsors
- StockCharts.com, Inc.
- Candle Patterns
- Candlestick Charting Explained
- Intermarket Technical Analysis
- John Murphy on Chart Analysis
- John Murphy's Chart Pattern Recognition
- John Murphy's Market Message
- MurphyExplainsMarketAnalysis-Intermarket Analysis
- MurphyExplainsMarketAnalysis-Visual Analysis
- StockCharts.com
- Technical Analysis of the Financial Markets
- The Visual Investor
- VectorVest, Inc.
- Executive Premier Workshop
- One-Day Options Course
- OptionsPro
- Retirement Income Workshop
- Sure-Fire Trading Systems (VectorVest, Inc.)
- Trading as a Business Workshop
- VectorVest 7 EOD
- VectorVest 7 RealTime/IntraDay
- VectorVest AutoTester
- VectorVest Educational Services
- VectorVest OnLine
- VectorVest Options Analyzer
- VectorVest ProGraphics v6.0
- VectorVest ProTrader 7
- VectorVest RealTime Derby Tool
- VectorVest Simulator
- VectorVest Variator
- VectorVest Watchdog
