HOT TOPICS LIST
- MACD
- Fibonacci
- RSI
- Gann
- ADXR
- Stochastics
- Volume
- Triangles
- Futures
- Cycles
- Volatility
- ZIGZAG
- MESA
- Retracement
- Aroon
INDICATORS LIST
LIST OF TOPICS
PRINT THIS ARTICLE
by Donald W. Pendergast, Jr.
The MetaStock price and volume breakout exploration has identified shares of Rowan Cos. as a strong price/breakout candidate.
Position: N/A
Donald W. Pendergast, Jr.
Donald W. Pendergast is a financial markets consultant who offers specialized services to stock brokers and high net worth individuals who seek a better bottom line for their portfolios.
PRINT THIS ARTICLE
TECHNICAL ANALYSIS
RDC Price And Volume Breakout
01/20/12 09:27:58 AMby Donald W. Pendergast, Jr.
The MetaStock price and volume breakout exploration has identified shares of Rowan Cos. as a strong price/breakout candidate.
Position: N/A
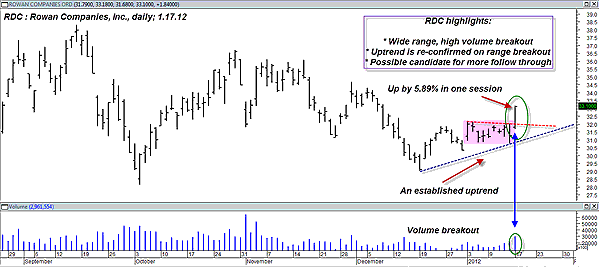
| Running my list of Standard & Poor's 500 component stock list through the MetaStock price and volume breakout exploration yielded two trading candidates for the next trading session: Rowan Cos. (RDC) (Figure 1) and Sears Holdings (SHLD). This powerful scanning tool will search for and find any and all stocks that have experienced a daily 5% price gain or higher, along with at least a 50% increase in volume compared to its previous 50 days' average trading volume. Such a tool can be of great interest to momentum traders desiring to capitalize on the tendency for some breakouts to experience significant short-term follow-through. So, here's a look at how the price/volume breakout in RDC actually played out. |

|
| FIGURE 1: RDC, DAILY. Not all breakouts follow through, but when a large-cap stock jumps nearly 6% in one day, it just might pay to track it for the next few sessions. |
| Graphic provided by: MetaStock. |
| |
| Of the two price/volume (PV) breakout candidates, RDC had a far more bullish chart dynamic, so that's the stock I chose for further evaluation. RDC experienced a fairly volatile decline -- with many tradable swings -- since peaking on March 30, 2011, but seemed to find a solid floor upon which to base near the $29 area on December 19, 2011, and now broke out of a small rectangle pattern with this recent, massive breakout. A solid uptrend line has formed in the process and with so much force propelling it out of the consolidation, the stock certainly looks as if it might actually be able to mount a retest of the November 30, 2011, swing high of $34.67, possibly sooner rather than later. See Figure 2. |

|
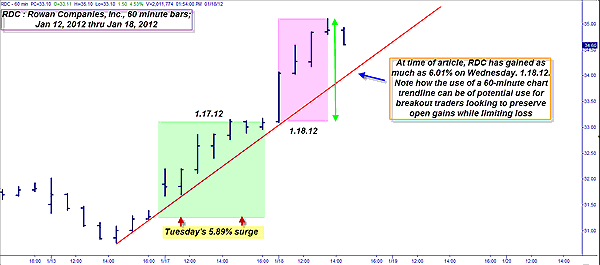
| FIGURE 2: RDC, HOURLY. This 60-minute chart of RDC demonstrates how traders might be able to use a fixed trendline as a stop-loss to manage any potential follow-through moves on a stock that had a major price/volume breakout in the previous session. |
| Graphic provided by: TradeStation. |
| |
| So how did this play out on the next trading day? Amazingly, at one point in the session, RDC was up as much as 6.01% from its opening price of $33.11, peaking intraday at $35.10 by 1330 Eastern time. Now that's follow-through! Note the red uptrend line that connects the lower edge of RDC's 60-minute bars since making Friday's low of $30.78; it looks like this could be a good trendline/stop-loss idea for aggressive traders looking to trade similar price/volume breakouts in the future. Depending on several factors (such as huge gaps higher after such an initial, huge PV breakout, average true range, and so on), such a trendline might help to keep losses small while allowing for some decent follow-through in subsequent trading sessions. In the case of RDC, the trendline stop is at $33.97, a full $0.88 above this morning's open of $33.11; obviously, this would work just fine for this particular trade, but every trade setup situation is a one-of-a-kind, unpredictable animal that can literally do anything it wants at any time, usually when it's least anticipated. However, this trendline stop idea should at least get your own creative juices flowing as you seek ways to better trade the markets. Check out the price/volume breakout scanning features in the charting/trading software that you use, and you'll probably be amazed at the PV trade setups that you'll be able to identify. |
Donald W. Pendergast is a financial markets consultant who offers specialized services to stock brokers and high net worth individuals who seek a better bottom line for their portfolios.
| Title: | Writer, market consultant |
| Company: | Linear Trading Systems LLC |
| Jacksonville, FL 32217 | |
| Phone # for sales: | 904-239-9564 |
| E-mail address: | lineartradingsys@gmail.com |
Traders' Resource Links | |
| Linear Trading Systems LLC has not added any product or service information to TRADERS' RESOURCE. | |
Click here for more information about our publications!
Comments

Request Information From Our Sponsors
- StockCharts.com, Inc.
- Candle Patterns
- Candlestick Charting Explained
- Intermarket Technical Analysis
- John Murphy on Chart Analysis
- John Murphy's Chart Pattern Recognition
- John Murphy's Market Message
- MurphyExplainsMarketAnalysis-Intermarket Analysis
- MurphyExplainsMarketAnalysis-Visual Analysis
- StockCharts.com
- Technical Analysis of the Financial Markets
- The Visual Investor
- VectorVest, Inc.
- Executive Premier Workshop
- One-Day Options Course
- OptionsPro
- Retirement Income Workshop
- Sure-Fire Trading Systems (VectorVest, Inc.)
- Trading as a Business Workshop
- VectorVest 7 EOD
- VectorVest 7 RealTime/IntraDay
- VectorVest AutoTester
- VectorVest Educational Services
- VectorVest OnLine
- VectorVest Options Analyzer
- VectorVest ProGraphics v6.0
- VectorVest ProTrader 7
- VectorVest RealTime Derby Tool
- VectorVest Simulator
- VectorVest Variator
- VectorVest Watchdog
