HOT TOPICS LIST
- MACD
- Fibonacci
- RSI
- Gann
- ADXR
- Stochastics
- Volume
- Triangles
- Futures
- Cycles
- Volatility
- ZIGZAG
- MESA
- Retracement
- Aroon
INDICATORS LIST
LIST OF TOPICS
PRINT THIS ARTICLE
by Donald W. Pendergast, Jr.
The Dogs of the Dow scanner template in TradeStation can help you find megacap stocks that pay a handsome dividend yield.
Position: N/A
Donald W. Pendergast, Jr.
Donald W. Pendergast is a financial markets consultant who offers specialized services to stock brokers and high net worth individuals who seek a better bottom line for their portfolios.
PRINT THIS ARTICLE
REL. STR COMPARATIVE
The High-Performance Dividends Stocks Of The Dow
01/19/12 08:47:36 AMby Donald W. Pendergast, Jr.
The Dogs of the Dow scanner template in TradeStation can help you find megacap stocks that pay a handsome dividend yield.
Position: N/A
| Some traders aren't interested in flipping stocks all day, being more content to simply buy high-quality stocks of well-established companies that pay solid, consistent dividends. Such stocks are often good candidates for covered-call writing, a strategy that can help bring in even more cash in a steadily uptrending market. TradeStation users have a ready ally in their quest to locate such stocks, and it comes preloaded in the Scanner area of TradeStation 9.0 and higher. Here's a look at how to put this useful feature to work for you today. |

|
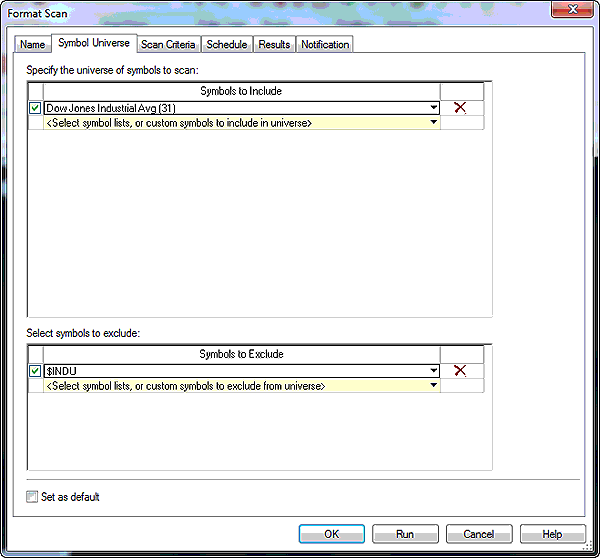
| FIGURE 1: SELECTING A STOCKLIST. Selecting a stocklist for the Dogs of the Dow scan template in TradeStation 9.0. |
| Graphic provided by: TradeStation. |
| Graphic provided by: TradeStation 9.0 Scanner. |
| |
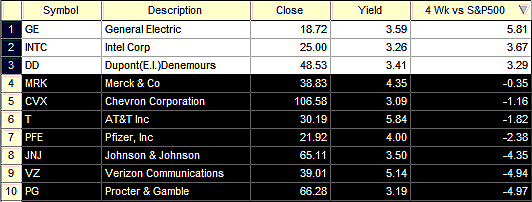
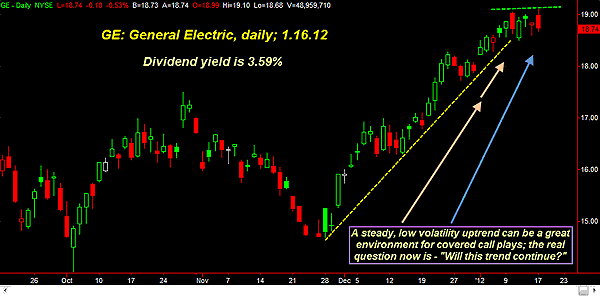
| Say you are tired of trading futures and forex because of the risk of trading on margin, and you don't have enough free time to sit in front of a screen to daytrade stocks, either. Yet you still want to trade or invest in a manner that's more in your control than by simply dollar-cost averaging every month in a basket of "hot today, cold tomorrow" mutual funds. What to do? Well, if you are a TradeStation user, you have an incredible array of scanning features that can help you locate the kind of stocks that best fit your own trading temperament and style. The Dogs of the Dow scan simply locates the top 10 dividend-yielding DJIA component stocks, but for this article, I'll add a simple price filter that will also show how each of those top 10 stocks has performed over the last four weeks, as compared to the performance of the .SPX over the same time period. See Figure 1. Adding this momentum comparison filter might be of enormous benefit to those traders who seek dividend-paying stocks that are in some sort of outperformance mode versus the major market averages. Bear in mind that we are talking about comparative relative strength here; just because Intel, General Electric, and Dupont are all performing better than the .SPY does not mean they are actually rising in price. In fact, until you look at a price chart, for all you know, they may simply be declining at a rate that is slower than the .SPX -- which is, technically speaking, outperforming. To set up the scan, simply open the Scanner, right-click on the screen and click on "View Trade Station Sample Scans." Scroll down the popup window until you reach the Value heading and then place your mouse pointer on the Dogs of the Dow icon and drag it to the left side of the screen into the scan formatting area. Click Format and then Symbol Universe and make sure that the Dow component stock list is checked, then click on the Scan Criteria tab. All you need to do to add the relative strength measure is to click on the Select Criteria arrow, click on the Price folder and then scroll down to the Net Chg folder and then select 4Wk vs. S&P 500 (Figure 2). With that criteria added, now simply click the arrow under the Operator tab and select the Top10 option. In the next box to the right, simply type in "10." Click Run and the top Dow yields will appear in a few moments; double-click the 4Wk vs. S&P 500 header and the top relative strength stocks among top 10 Dow dividend yielders will be sorted from the strongest to the weakest. The scan reveals that INTC, GE, and DD are the best-performing Dow stocks (among the highest-yielding stocks in the DJIA) vs. the .SPX over the last month (Figure 3). Glancing at a daily chart of GE (Figure 4), we find that the stock has been in a seven-week uptrend, which is generally what a covered-call seller loves to see before initiating a buy-write order (buying 100 shares of a stock or multiple thereof and selling a call option or options against the stock). Depending on the holding period for the trade, the strike prices of the options sold, and so on, if such trades pan out, the call seller not only makes money on the price appreciation of the stock, but they may very well snag a quarterly dividend payment along the way and also get to keep the full premium of the call options or options that were sold. Under the right market conditions (a fairly quiet and steady uptrend with modest volatility), such trades can be real cash cows, ones that don't cause a lot of heartburn or worries for the traders who rely on them for steady income. Of course, no one knows if GE's current, lovely uptrend will continue, stall, or tumble and fall, but savvy covered-call players sell covered calls on rock-solid, megacap, outperforming stocks that pay a great dividend. Sometimes simple really is better, isn't it? |

|
| FIGURE 2: ADDING A FILTER. The only change made to the standard scan criteria is to add a four-week comparative relative strength (vs. the .SPX) filter. |
| Graphic provided by: TradeStation. |
| Graphic provided by: TradeStation 9.0 Scanner. |
| |

|
| FIGURE 3: THE TOP 10. Sorting by highest relative strength, we find that GE, INTC, and DD all may be worthy of further investigation. |
| Graphic provided by: TradeStation. |
| Graphic provided by: TradeStation 9.0 Scanner. |
| |

|
| FIGURE 4: GE, DAILY. Sure, it's a seven-week-old uptrend, but until it finally breaks down or starts to go sideways, it's usually best to give such strong trends every benefit of the doubt. Steady, low-volatility uptrends tend to be the ideal environment for covered-call trade setups, all else being equal. |
| Graphic provided by: TradeStation. |
| |
Donald W. Pendergast is a financial markets consultant who offers specialized services to stock brokers and high net worth individuals who seek a better bottom line for their portfolios.
| Title: | Writer, market consultant |
| Company: | Linear Trading Systems LLC |
| Jacksonville, FL 32217 | |
| Phone # for sales: | 904-239-9564 |
| E-mail address: | lineartradingsys@gmail.com |
Traders' Resource Links | |
| Linear Trading Systems LLC has not added any product or service information to TRADERS' RESOURCE. | |
Click here for more information about our publications!
Comments

Request Information From Our Sponsors
- StockCharts.com, Inc.
- Candle Patterns
- Candlestick Charting Explained
- Intermarket Technical Analysis
- John Murphy on Chart Analysis
- John Murphy's Chart Pattern Recognition
- John Murphy's Market Message
- MurphyExplainsMarketAnalysis-Intermarket Analysis
- MurphyExplainsMarketAnalysis-Visual Analysis
- StockCharts.com
- Technical Analysis of the Financial Markets
- The Visual Investor
- VectorVest, Inc.
- Executive Premier Workshop
- One-Day Options Course
- OptionsPro
- Retirement Income Workshop
- Sure-Fire Trading Systems (VectorVest, Inc.)
- Trading as a Business Workshop
- VectorVest 7 EOD
- VectorVest 7 RealTime/IntraDay
- VectorVest AutoTester
- VectorVest Educational Services
- VectorVest OnLine
- VectorVest Options Analyzer
- VectorVest ProGraphics v6.0
- VectorVest ProTrader 7
- VectorVest RealTime Derby Tool
- VectorVest Simulator
- VectorVest Variator
- VectorVest Watchdog
