HOT TOPICS LIST
- MACD
- Fibonacci
- RSI
- Gann
- ADXR
- Stochastics
- Volume
- Triangles
- Futures
- Cycles
- Volatility
- ZIGZAG
- MESA
- Retracement
- Aroon
INDICATORS LIST
LIST OF TOPICS
PRINT THIS ARTICLE
by Koos van der Merwe
Finding a share to consider buying is not an easy process.
Position: Accumulate
Koos van der Merwe
Has been a technical analyst since 1969, and has worked as a futures and options trader with First Financial Futures in Johannesburg, South Africa.
PRINT THIS ARTICLE
HEAD & SHOULDERS
A Look At United Continental Holdings
01/19/12 08:27:49 AMby Koos van der Merwe
Finding a share to consider buying is not an easy process.
Position: Accumulate
| Rather than eyeball 2,000-plus stocks looking for that specific tradable that meets your parameters, I find it very comfortable to use a program that can do that for me. MetaStock is one, Technifilter Plus is another. I prefer using the mechanical side of OmniTrader Plus simply because you can develop strategies that meet the parameters you want to identify in a stock. I also like their charts with the patterns and buy signals they offer. |

|
| FIGURE 1: RESULTS OF MARKET ANALYSIS |
| Graphic provided by: OmniTrader. |
| |
| Figure 1 is the focus list suggesting the shares I should look at. The first share is United Continental Holdings (UAL), which has with an advisor rating (ADV) of 59 and a backtest hit rate of 100. The higher the figure, the better the chances that the strategy used will carry into the future. In addition, note the strategy that triggered the stock as a possible buy. The red green strategy signals a buy when today's close is greater than the high of 10 days ago. A short sale is triggered when today's close is lower than the low of six days ago. It's simple and sweet. |

|
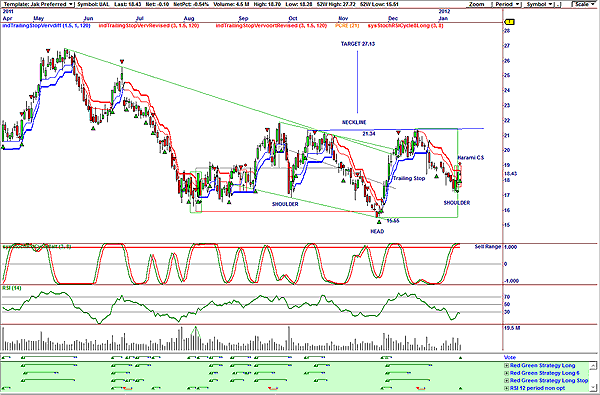
| FIGURE 2: UAL, DAILY |
| Graphic provided by: OmniTrader. |
| |
| Figure 2 is a daily chart of UAL, and it shows the following: a. An inverted head & shoulders formation that could be developing with a possible target of $27.13 (21.34-15.55=5.79+21.34=27.13). The formation will trigger a buy signal when the price breaks above the neckline at $21.24. b. Trailing stop signal. The price is below the trailing stop, suggesting weakness is still present. c. A harami candlestick formation has been given. Haramis generally signal an end to the current trend. d. The indicator. Stochastic RSI cycle has broken above the sell range, suggesting a possible correction. e. The relative strength index (RSI), which is oversold but has not yet given a buy signal. f. Finally, the vote line, which has given a buy signal. This is the analysis summation of the various strategies shown in green below the vote box. In this instance, the 12-period RSI strategy carried the most weight and triggered the buy signal. The stock has now been placed on my watchlist for a future buy. |
Has been a technical analyst since 1969, and has worked as a futures and options trader with First Financial Futures in Johannesburg, South Africa.
| Address: | 3256 West 24th Ave |
| Vancouver, BC | |
| Phone # for sales: | 6042634214 |
| E-mail address: | petroosp@gmail.com |
Click here for more information about our publications!
PRINT THIS ARTICLE

Request Information From Our Sponsors
- StockCharts.com, Inc.
- Candle Patterns
- Candlestick Charting Explained
- Intermarket Technical Analysis
- John Murphy on Chart Analysis
- John Murphy's Chart Pattern Recognition
- John Murphy's Market Message
- MurphyExplainsMarketAnalysis-Intermarket Analysis
- MurphyExplainsMarketAnalysis-Visual Analysis
- StockCharts.com
- Technical Analysis of the Financial Markets
- The Visual Investor
- VectorVest, Inc.
- Executive Premier Workshop
- One-Day Options Course
- OptionsPro
- Retirement Income Workshop
- Sure-Fire Trading Systems (VectorVest, Inc.)
- Trading as a Business Workshop
- VectorVest 7 EOD
- VectorVest 7 RealTime/IntraDay
- VectorVest AutoTester
- VectorVest Educational Services
- VectorVest OnLine
- VectorVest Options Analyzer
- VectorVest ProGraphics v6.0
- VectorVest ProTrader 7
- VectorVest RealTime Derby Tool
- VectorVest Simulator
- VectorVest Variator
- VectorVest Watchdog
