HOT TOPICS LIST
- MACD
- Fibonacci
- RSI
- Gann
- ADXR
- Stochastics
- Volume
- Triangles
- Futures
- Cycles
- Volatility
- ZIGZAG
- MESA
- Retracement
- Aroon
INDICATORS LIST
LIST OF TOPICS
PRINT THIS ARTICLE
by Mike Carr, CMT
This company gained about 20% in the first 10 trading days of 2012 and could be a buy even after that gain.
Position: Buy
Mike Carr, CMT
Mike Carr, CMT, is a member of the Market Technicians Association, and editor of the MTA's newsletter, Technically Speaking. He is also the author of "Smarter Investing in Any Economy: The Definitive Guide to Relative Strength Investing," and "Conquering the Divide: How to Use Economic Indicators to Catch Stock Market Trends."
PRINT THIS ARTICLE
RATE OF CHANGE
Adams Golf Starts The Year With Strong Gains
01/18/12 09:51:03 AMby Mike Carr, CMT
This company gained about 20% in the first 10 trading days of 2012 and could be a buy even after that gain.
Position: Buy
| Adams Golf (ADGF) gained more than 35% in 2011 and started 2012 with big gains. This is a small company that in many ways fits the profile of a potential long-term winner. It sells gold clubs and consistently shows a market share of at least 10% in a very large market. Being in a growth industry with room to expand, ADGF is well positioned for long-term investors. Insiders own more than half of the outstanding shares but have been selling shares with automatic plans that are unlikely to disrupt the market. The market cap is very small, about $60 million, and the average volume is light at less than 15,000 shares a day. That is a recipe for high spreads, and on a recent trading day, the bid/ask spread in ADGF was about 25 cents, about 3.2% of the stock's price. Entering and exiting on market orders could cost a trader 7% or more, so traders should use only limit orders with a stock like this. |
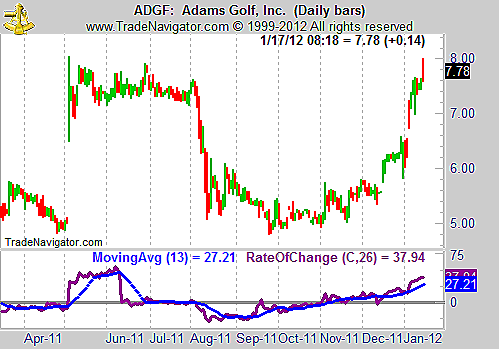
| Short term, the daily chart shows a potential breakout (Figure 1). This is where chart analysts can disagree on specifics, but whether they call the recent price action a potential cup & handle, a rounding bottom, or any other name, the implications are bullish. ADGF recently broke above resistance near $7 and the pattern points to a large potential gain of about $3 a share, or nearly 40%. The pattern also highlights a potential stop-loss since resistance that is broken becomes support, and that would offer a potential risk of about 5% on the trade. Given the relative illiquidity of ADGF, traders should expect that a loss would be greater than that, since the spread on this stock is so wide. |

|
| FIGURE 1: ADGF, DAILY. The daily chart of ADGF shows a breakout above resistance and completion of a months-long bottoming pattern. |
| Graphic provided by: Trade Navigator. |
| |
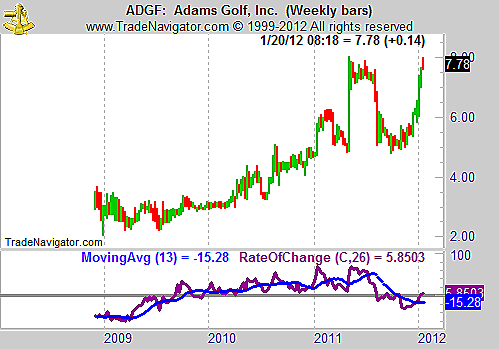
| The daily chart also highlights the strong momentum in the stock, shown as the 26-day rate of change (ROC) indicator. As the price bottom in ADGF was forming in the autumn, the ROC turned positive, a bullish indicator. The weekly chart, shown in Figure 2, shows a similar chart pattern with long-term resistance being broken and a more recent bullish signal from the ROC, which has just turned positive over the longer time frame. |

|
| FIGURE 2: ADGF, WEEKLY. ADGF has been a long-term winner with a gain of more than 275% in the past three years. |
| Graphic provided by: Trade Navigator. |
| |
| The high degree of insider ownership in ADGF shows that management has strong motivation to maximize shareholder value. In early January, the board of directors of the company announced that they had retained Morgan Stanley to review strategic options. That proved to be a catalyst for a short-term gain in the stock price. Longer term, the review may end without any action being taken, or it could lead to a buyout offer, capping potential gains in the stock. |
| ADGF fits the profile of a potential long-term winner. It is a small company with a strong record of sales and earnings. It has a good chart pattern in addition to solid fundamentals and management has a vested interest in the success of the company. The company is in a boring industry, the kind that has created some of the biggest stock market winners of all time. ADGF also offers the potential for a short-term trade with limited risk near $7 and the ability to use a trailing stop to capture long-term gains. |
Mike Carr, CMT, is a member of the Market Technicians Association, and editor of the MTA's newsletter, Technically Speaking. He is also the author of "Smarter Investing in Any Economy: The Definitive Guide to Relative Strength Investing," and "Conquering the Divide: How to Use Economic Indicators to Catch Stock Market Trends."
| Website: | www.moneynews.com/blogs/MichaelCarr/id-73 |
| E-mail address: | marketstrategist@gmail.com |
Click here for more information about our publications!
PRINT THIS ARTICLE

Request Information From Our Sponsors
- VectorVest, Inc.
- Executive Premier Workshop
- One-Day Options Course
- OptionsPro
- Retirement Income Workshop
- Sure-Fire Trading Systems (VectorVest, Inc.)
- Trading as a Business Workshop
- VectorVest 7 EOD
- VectorVest 7 RealTime/IntraDay
- VectorVest AutoTester
- VectorVest Educational Services
- VectorVest OnLine
- VectorVest Options Analyzer
- VectorVest ProGraphics v6.0
- VectorVest ProTrader 7
- VectorVest RealTime Derby Tool
- VectorVest Simulator
- VectorVest Variator
- VectorVest Watchdog
- StockCharts.com, Inc.
- Candle Patterns
- Candlestick Charting Explained
- Intermarket Technical Analysis
- John Murphy on Chart Analysis
- John Murphy's Chart Pattern Recognition
- John Murphy's Market Message
- MurphyExplainsMarketAnalysis-Intermarket Analysis
- MurphyExplainsMarketAnalysis-Visual Analysis
- StockCharts.com
- Technical Analysis of the Financial Markets
- The Visual Investor
