HOT TOPICS LIST
- MACD
- Fibonacci
- RSI
- Gann
- ADXR
- Stochastics
- Volume
- Triangles
- Futures
- Cycles
- Volatility
- ZIGZAG
- MESA
- Retracement
- Aroon
INDICATORS LIST
LIST OF TOPICS
PRINT THIS ARTICLE
by Mike Carr, CMT
Crude oil is likely to extend its three-year trading range, which forecasts a short-term drop in the price.
Position: Sell
Mike Carr, CMT
Mike Carr, CMT, is a member of the Market Technicians Association, and editor of the MTA's newsletter, Technically Speaking. He is also the author of "Smarter Investing in Any Economy: The Definitive Guide to Relative Strength Investing," and "Conquering the Divide: How to Use Economic Indicators to Catch Stock Market Trends."
PRINT THIS ARTICLE
RATE OF CHANGE
Crude Likely To Stay In Trading Range
01/17/12 01:59:41 PMby Mike Carr, CMT
Crude oil is likely to extend its three-year trading range, which forecasts a short-term drop in the price.
Position: Sell
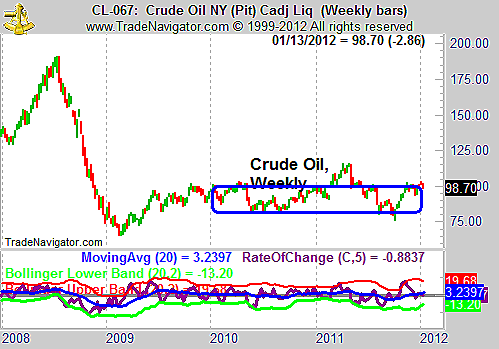
| In 2008, crude oil entered bubble territory. "Bubble" is a term that is used with an almost stunning regularity, and almost any market showing a rapid price rise is said to be in a bubble. Currently, many market commentators are suggesting that Treasury bonds and notes are in a bubble. The rapid price gains of almost 50% in 10-year Treasury note prices certainly meet part of the definition of a bubble, but equally important is a price that is disconnected from fundamentals. Treasuries are paying a very low nominal interest rate because investors are willing to accept a small amount of return on their investment. Investors seem to believe that inflation and economic growth will remain at low levels, and low interest rates are associated with these conditions. The fundamental reason for high Treasury prices argues against a bubble in that market. For crude oil in the summer of 2008, there was no fundamental reason that oil should have spiked nearly 80% in only 52 weeks. The price of oil is directly related to the pace of economic activity, and the economy was slowing dramatically as oil peaked. Rapid price gains disconnected from underlying fundamentals defined the oil market, and the post-bubble crash saw prices fall by more than 65%. As Figure 1 shows, the price of crude oil has remained in a trading range since that crash. |

|
| FIGURE 1: CRUDE OIL, WEEKLY. Crude oil shows the rapid gains, equally rapid decline, and an extended trading range, a price pattern that is usually associated with market bubbles. |
| Graphic provided by: Trade Navigator. |
| |
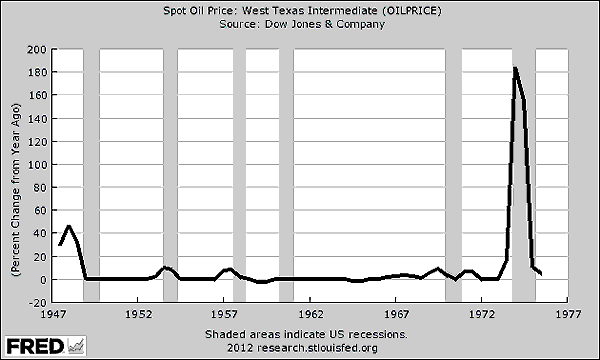
| Markets in true bubbles tend to trade near the level of their post-bubble crash low for years after the top. That is the type of behavior that has defined oil since it bottomed in 2009. Momentum on the weekly chart shows that oil reached an oversold level on its last price bounce and the churning action in price seen over the past few weeks is likely to be resolved to the downside. Momentum is shown as the five-week rate of change in Figure 1, and Bollinger Bands have been added to the indicator to highlight high and low extremes. With Bollinger Bands on the indicator, overbought and oversold levels adapt to the recent market action. Static levels for indicators, such as the idea that the relative strength index (RSI) is oversold below 30, can be unreliable. While oil is expected to fall based on the chart, that has interesting implications for the economy. The price of crude oil is often viewed as an important economic indicator. This is because in the decades after World War II, price spike in oil tended to come right before recessions (Figure 2). |

|
| FIGURE 2: SPOT OIL. Oil price peaks occurred as an economic slowdown began in the 20 years after World War II. (Source: US Federal Reserve) |
| Graphic provided by: Trade Navigator. |
| |
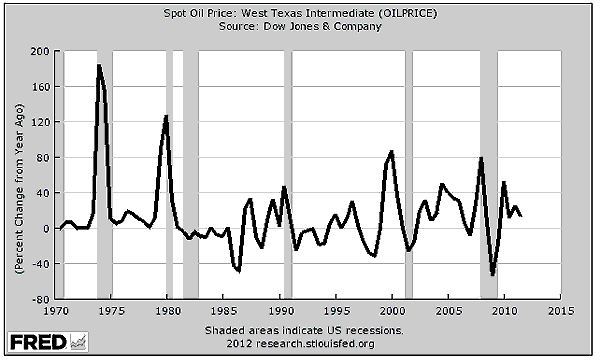
| The price swings in oil became more extreme starting in the early 1970s, but the general pattern remained the same -- price spikes in oil were often followed by a recession (Figure 3). |

|
| FIGURE 3: SPOT OIL. Oil price volatility increased sharply in the early 1970s, but oil maintained its reliability as an economic indicator. (Source: US Federal Reserve) |
| Graphic provided by: Trade Navigator. |
| |
| Before falling recently, the 52-week rate of change (ROC) of oil spiked to more than 40%, a level that was reached before every other recession since the 1970s. There was only one time that indicator did not correctly forecast a recession. Based on the price of oil, it could be possible that a recession is coming within the next year. Interest rates are low and declining, which argues for slow economic growth or even a recession. Oil is at the upper end of a trading range that has contained prices for more than three years. There may or may not be a recession, but it does seem very likely that oil will fall back toward $80 a barrel based on both fundamentals and technical patterns. |
Mike Carr, CMT, is a member of the Market Technicians Association, and editor of the MTA's newsletter, Technically Speaking. He is also the author of "Smarter Investing in Any Economy: The Definitive Guide to Relative Strength Investing," and "Conquering the Divide: How to Use Economic Indicators to Catch Stock Market Trends."
| Website: | www.moneynews.com/blogs/MichaelCarr/id-73 |
| E-mail address: | marketstrategist@gmail.com |
Click here for more information about our publications!
PRINT THIS ARTICLE

Request Information From Our Sponsors
- StockCharts.com, Inc.
- Candle Patterns
- Candlestick Charting Explained
- Intermarket Technical Analysis
- John Murphy on Chart Analysis
- John Murphy's Chart Pattern Recognition
- John Murphy's Market Message
- MurphyExplainsMarketAnalysis-Intermarket Analysis
- MurphyExplainsMarketAnalysis-Visual Analysis
- StockCharts.com
- Technical Analysis of the Financial Markets
- The Visual Investor
- VectorVest, Inc.
- Executive Premier Workshop
- One-Day Options Course
- OptionsPro
- Retirement Income Workshop
- Sure-Fire Trading Systems (VectorVest, Inc.)
- Trading as a Business Workshop
- VectorVest 7 EOD
- VectorVest 7 RealTime/IntraDay
- VectorVest AutoTester
- VectorVest Educational Services
- VectorVest OnLine
- VectorVest Options Analyzer
- VectorVest ProGraphics v6.0
- VectorVest ProTrader 7
- VectorVest RealTime Derby Tool
- VectorVest Simulator
- VectorVest Variator
- VectorVest Watchdog
