HOT TOPICS LIST
- MACD
- Fibonacci
- RSI
- Gann
- ADXR
- Stochastics
- Volume
- Triangles
- Futures
- Cycles
- Volatility
- ZIGZAG
- MESA
- Retracement
- Aroon
INDICATORS LIST
LIST OF TOPICS
PRINT THIS ARTICLE
by Koos van der Merwe
In an earlier article, I compared Bershire Hathaway B shares to the S&P 500 and concluded that the shares could be used as a market leader. Is that still the case?
Position: Buy
Koos van der Merwe
Has been a technical analyst since 1969, and has worked as a futures and options trader with First Financial Futures in Johannesburg, South Africa.
PRINT THIS ARTICLE
REL. STR COMPARATIVE
Is Berkshire Hathaway B Shares Still A Market Leader?
01/17/12 09:47:22 AMby Koos van der Merwe
In an earlier article, I compared Bershire Hathaway B shares to the S&P 500 and concluded that the shares could be used as a market leader. Is that still the case?
Position: Buy
| Warren Buffett is arguably America's most admired and most followed investor. Legions of investors from all walks of life follow his investment philosophy: Invest in what you know and invest in value. |

|
| FIGURE 1: BERKSHIRE HATHAWAY VS. S&P 500, DAILY |
| Graphic provided by: MetaStock. |
| |
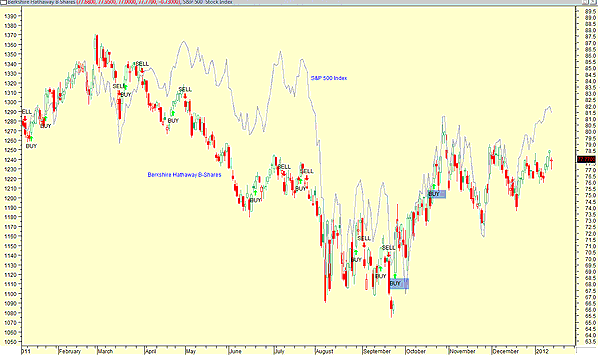
| Figure 1 shows the Standard & Poor's 500 superimposed on a chart of Berkshire Hathaway. We can see how closely the lows and highs of the two charts relate to each other. Note also on the chart the buy and sell signals on the Berkshire Hathaway graph. These signals are given by the RSI-RSI buy and sell signals. Both formulas are shown here in MetaStock code. At the moment the signals are giving a buy signal. RSI-RSI BUY Formula bc1:= Cross( RSI(17) > 60 AND C > Mov( C, 40, S), 0.5); bc2:= Cross( RSI(5) > 60 AND C > Mov( C, 10, S), 0.5); sc1:= Cross( RSI(17) < 40 AND C < Mov( C, 40, S), 0.5); sc2:= Cross( RSI(5) < 40 AND C < Mov( C, 10, S), 0.5); trade1:= If(bc1, 1, If(sc1, 0, PREV)); trade2:= If(bc2, 1, If(sc2, 0, PREV)); Cross(trade1=1, 0.5) OR (trade1=0 AND Cross(trade2=1, 0.5)) RSI-RSI SELL formula. bc1:= Cross( RSI(17) > 60 AND C > Mov( C, 40, S), 0.5); bc2:= Cross( RSI(5) > 60 AND C > Mov( C, 10, S), 0.5); sc1:= Cross( RSI(17) < 40 AND C < Mov( C, 40, S), 0.5); sc2:= Cross( RSI(5) < 40 AND C < Mov( C, 10, S), 0.5); trade1:= If(bc1, 1, If(sc1, 0, PREV)); trade2:= If(bc2, 1, If(sc2, 0, PREV)); Cross(trade1=0, 0.5) OR (trade1=0 AND Cross(trade2=0, 0.5)) |

|
| FIGURE 2: BERKSHIRE HATHAWAY, WITH TRIANGLE FORMATION |
| Graphic provided by: AdvancedGET. |
| |
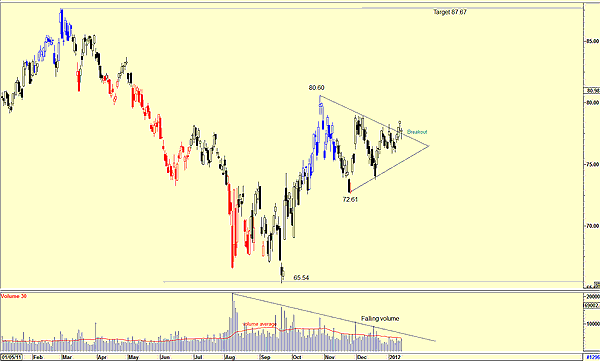
| Figure 2 is a daily chart of Berkshire Hathaway and show that the share price has formed a triangle. Triangles usually act as a period of consolidation from which prices continue on in the same direction. They form as a result of indecision on the part of both buyers and sellers. During this time, market participants tend to shift to the sidelines, resulting in narrower market fluctuations and diminishing volume. With the indecision in Europe and the US political scene, we can understand the formation of this triangle. A breakout usually occurs as a result of some news that affects the market. This breakout is usually accompanied by an increase in volume. The chart has shown that the price has broken above the downtrend line of the triangle. Volume should start increasing, and when volume breaks above the red line average shown, a buy signal will be given, with a target price of $87.67 (80.60 - 65.54 = 15.06 + 72.61 = 87.67). With Berkshire Hathaway shares showing the possibility of a buy signal after a symmetrical triangle formation, and a target of $87.67, the S&P 500 should by all accounts be in a bull market trend. |
Has been a technical analyst since 1969, and has worked as a futures and options trader with First Financial Futures in Johannesburg, South Africa.
| Address: | 3256 West 24th Ave |
| Vancouver, BC | |
| Phone # for sales: | 6042634214 |
| E-mail address: | petroosp@gmail.com |
Click here for more information about our publications!
PRINT THIS ARTICLE

|

Request Information From Our Sponsors
- StockCharts.com, Inc.
- Candle Patterns
- Candlestick Charting Explained
- Intermarket Technical Analysis
- John Murphy on Chart Analysis
- John Murphy's Chart Pattern Recognition
- John Murphy's Market Message
- MurphyExplainsMarketAnalysis-Intermarket Analysis
- MurphyExplainsMarketAnalysis-Visual Analysis
- StockCharts.com
- Technical Analysis of the Financial Markets
- The Visual Investor
- VectorVest, Inc.
- Executive Premier Workshop
- One-Day Options Course
- OptionsPro
- Retirement Income Workshop
- Sure-Fire Trading Systems (VectorVest, Inc.)
- Trading as a Business Workshop
- VectorVest 7 EOD
- VectorVest 7 RealTime/IntraDay
- VectorVest AutoTester
- VectorVest Educational Services
- VectorVest OnLine
- VectorVest Options Analyzer
- VectorVest ProGraphics v6.0
- VectorVest ProTrader 7
- VectorVest RealTime Derby Tool
- VectorVest Simulator
- VectorVest Variator
- VectorVest Watchdog
