HOT TOPICS LIST
- MACD
- Fibonacci
- RSI
- Gann
- ADXR
- Stochastics
- Volume
- Triangles
- Futures
- Cycles
- Volatility
- ZIGZAG
- MESA
- Retracement
- Aroon
INDICATORS LIST
LIST OF TOPICS
PRINT THIS ARTICLE
by Koos van der Merwe
JP Morgan Chase has shown a double bottom. Is it a buy?
Position: Hold
Koos van der Merwe
Has been a technical analyst since 1969, and has worked as a futures and options trader with First Financial Futures in Johannesburg, South Africa.
PRINT THIS ARTICLE
DOUBLE BOTTOMS
Double Double With JP Morgan Chase
01/16/12 09:58:32 AMby Koos van der Merwe
JP Morgan Chase has shown a double bottom. Is it a buy?
Position: Hold
| With the start of 2012, the market appears to be flirting with a bull. No wonder, then, that consumer sentiment is starting to become more positive. Investors are scouring the shares looking for bargains -- shares that they believe will move up strongly. With a double bottom, JP Morgan Chase looks as if it could be one of those shares, especially now that the share price at the time of this writing is down 3.74% because fourth-quarter profit fell 23% amid declines in trading revenue and investment banking fees. To what extent does this affect the share price over the long term? Investors are starting to buy riskier assets such as financial debt and stocks as manufacturing reports bolster optimism about the global economy. |

|
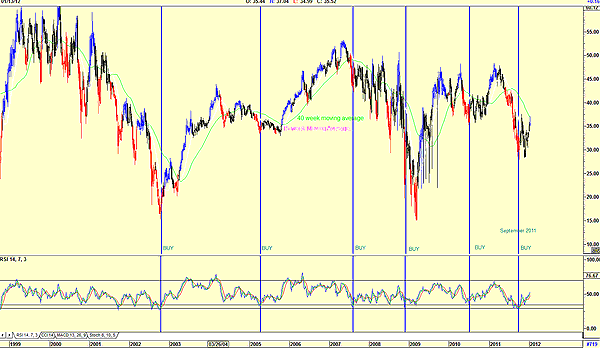
| FIGURE 1: JPM, WEEKLY. Here's the weekly chart showing RSI buy signals. |
| Graphic provided by: AdvancedGET. |
| |
| Figure 1 is a weekly chart with a relative strength index (RSI). Note how the RSI has been successful in giving buy signals, even though the signals given in 2007 and 2008 may have been premature. In September 2011,the RSI gave another buy signal. The share price rose and then fell to form a double bottom. Note that the share price is testing the 40-week moving average. A 40-week moving average is the 200-day moving average (40 x 5 days per week = 200 days). |

|
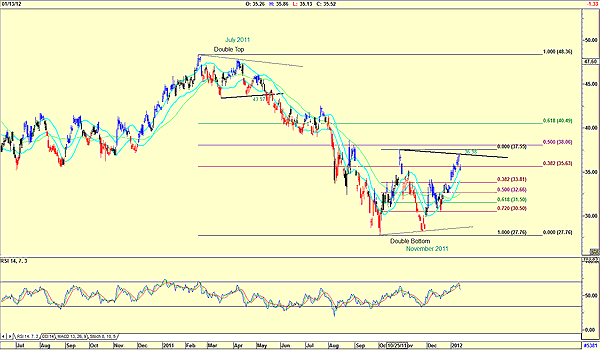
| FIGURE 2: JPM, DAILY. Here's a daily chart showing a double bottom. |
| Graphic provided by: AdvancedGET. |
| |
| Figure 2 is a daily chart and shows how the share price formed a double top in July 2011. A sell signal was given when the share price broke below 43.97. In November 2011, the share price formed a double bottom. This means that a buy signal will only be given should the price break above $36.98. Had the price not retraced on January 13, the price would have had to break above $37.55, the top in the W double bottom. Fibonacci extensions suggest a target of $38.06 (50%) or $40.49 (61.8%). The price is above the buy band of the JM internal band indicator (15-period moving average offset by 2% positive and 2% negative). A negative is the RSI which, although it has not given a sell signal, is approaching overbought levels, suggesting that the share price could retrace to the Fibonacci level of $33.82 (38.2%) or lower to the 50% or 61.8% Fib levels. The share is definitely on my watchlist for a future buy. |
Has been a technical analyst since 1969, and has worked as a futures and options trader with First Financial Futures in Johannesburg, South Africa.
| Address: | 3256 West 24th Ave |
| Vancouver, BC | |
| Phone # for sales: | 6042634214 |
| E-mail address: | petroosp@gmail.com |
Click here for more information about our publications!
Comments

|

Request Information From Our Sponsors
- StockCharts.com, Inc.
- Candle Patterns
- Candlestick Charting Explained
- Intermarket Technical Analysis
- John Murphy on Chart Analysis
- John Murphy's Chart Pattern Recognition
- John Murphy's Market Message
- MurphyExplainsMarketAnalysis-Intermarket Analysis
- MurphyExplainsMarketAnalysis-Visual Analysis
- StockCharts.com
- Technical Analysis of the Financial Markets
- The Visual Investor
- VectorVest, Inc.
- Executive Premier Workshop
- One-Day Options Course
- OptionsPro
- Retirement Income Workshop
- Sure-Fire Trading Systems (VectorVest, Inc.)
- Trading as a Business Workshop
- VectorVest 7 EOD
- VectorVest 7 RealTime/IntraDay
- VectorVest AutoTester
- VectorVest Educational Services
- VectorVest OnLine
- VectorVest Options Analyzer
- VectorVest ProGraphics v6.0
- VectorVest ProTrader 7
- VectorVest RealTime Derby Tool
- VectorVest Simulator
- VectorVest Variator
- VectorVest Watchdog
