HOT TOPICS LIST
- MACD
- Fibonacci
- RSI
- Gann
- ADXR
- Stochastics
- Volume
- Triangles
- Futures
- Cycles
- Volatility
- ZIGZAG
- MESA
- Retracement
- Aroon
INDICATORS LIST
LIST OF TOPICS
PRINT THIS ARTICLE
by Chaitali Mohile
Bearish reversal candlestick patterns have temporarily terminated the bullish rally of APL.
Position: N/A
Chaitali Mohile
Active trader in the Indian stock markets since 2003 and a full-time writer. Trading is largely based upon technical analysis.
PRINT THIS ARTICLE
CANDLESTICK CHARTING
APL Near Support
01/16/12 12:56:52 PMby Chaitali Mohile
Bearish reversal candlestick patterns have temporarily terminated the bullish rally of APL.
Position: N/A
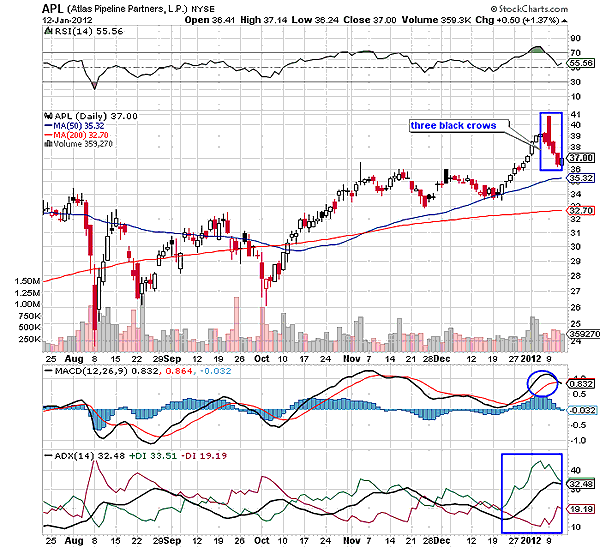
| The three black crows is a bearish reversal candlestick formation that converts an existing downtrend to up. In this formation, three red bearish candles are formed; each candle opens near or below the previous close and forms a fresh low. The three black crows candlestick pattern formed close to the 41 levels in Atlas Pipeline Partners (APL). We can see three large red candles in Figure 1, closing at a new low. The three consecutive red candles weakened the existing bullish force; as a result, APL tumbled to 37 levels. The stock suffered a loss of $5 in just three days. |
| The relative strength index (RSI) (14) in Figure 1 failed to form the series of higher highs and lows similar to the price rally. The indicator's movement was restricted by the bullish 60 levels, and therefore, it could not sustain above this level. The reversing RSI (14) confirmed the bearish reversal candlestick pattern. The positive moving average convergence/divergence (MACD) (12,26,9) suddenly showed a sign of bearish crossover in Figure 1. The average directional index (ADX) (14) is reflecting a developed uptrend. This signifies that the lack of bullish strength was the main culprit of this bearish rally. |

|
| FIGURE 1: APL, DAILY |
| Graphic provided by: StockCharts.com. |
| |
| APL has the support of the 50-day moving average (MA) at 35 levels; therefore, the current declining rally has limited downside. Since the bullish trend is not reversed by the three black crows formation, the stock would resume its upward journey with this support. |
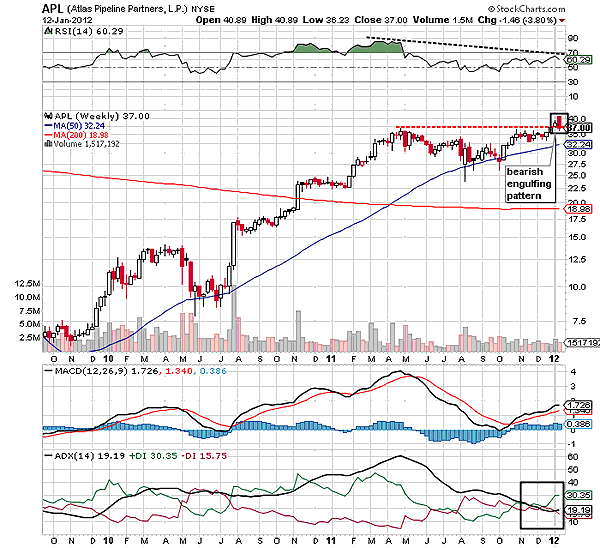
| In early 2011, APL made an all-time high at $37. Extremely bullish indicators in Figure 2 initiated a fresh bearish rally. However, the ascending 50-day MA extended support to the new downward rally, preventing additional damage. APL surged with this support and soon reached the previous high of 37 levels. We can see a bearish engulfing pattern near the resistance level in Figure 2. The RSI (14) is showing negative divergence, and the ADX (14) is marginally away from the 20 (developing trend) levels. The gap between the MACD and the trigger line is very narrow. Therefore, the stock is likely to stay volatile near the resistance line (red dotted line). |

|
| FIGURE 2: APL, WEEKLY |
| Graphic provided by: StockCharts.com. |
| |
| Due to the bearish engulfing candlestick pattern, APL would retrace toward the 50-day MA support. To sustain or surge above the resistance line, APL should enter a fresh uptrend and generate robust bullish strength. Since the 50-day MA is much closer, the stock would undergo a short-term bearish rally. Thus, the bearish pressure on APL would sustain for a very short period. |
Active trader in the Indian stock markets since 2003 and a full-time writer. Trading is largely based upon technical analysis.
| Company: | Independent |
| Address: | C1/3 Parth Indraprasth Towers. Vastrapur |
| Ahmedabad, Guj 380015 | |
| E-mail address: | chaitalimohile@yahoo.co.in |
Traders' Resource Links | |
| Independent has not added any product or service information to TRADERS' RESOURCE. | |
Click here for more information about our publications!
PRINT THIS ARTICLE

Request Information From Our Sponsors
- StockCharts.com, Inc.
- Candle Patterns
- Candlestick Charting Explained
- Intermarket Technical Analysis
- John Murphy on Chart Analysis
- John Murphy's Chart Pattern Recognition
- John Murphy's Market Message
- MurphyExplainsMarketAnalysis-Intermarket Analysis
- MurphyExplainsMarketAnalysis-Visual Analysis
- StockCharts.com
- Technical Analysis of the Financial Markets
- The Visual Investor
- VectorVest, Inc.
- Executive Premier Workshop
- One-Day Options Course
- OptionsPro
- Retirement Income Workshop
- Sure-Fire Trading Systems (VectorVest, Inc.)
- Trading as a Business Workshop
- VectorVest 7 EOD
- VectorVest 7 RealTime/IntraDay
- VectorVest AutoTester
- VectorVest Educational Services
- VectorVest OnLine
- VectorVest Options Analyzer
- VectorVest ProGraphics v6.0
- VectorVest ProTrader 7
- VectorVest RealTime Derby Tool
- VectorVest Simulator
- VectorVest Variator
- VectorVest Watchdog
