HOT TOPICS LIST
- MACD
- Fibonacci
- RSI
- Gann
- ADXR
- Stochastics
- Volume
- Triangles
- Futures
- Cycles
- Volatility
- ZIGZAG
- MESA
- Retracement
- Aroon
INDICATORS LIST
LIST OF TOPICS
PRINT THIS ARTICLE
by Billy Williams
The great Green Bay Packers coach, Vince Lombardi, was a big believer in the drilling of basics to his players. For traders, a solid foundation in trading fundamentals is just as invaluable.
Position: Hold
Billy Williams
Billy Williams has been trading the markets for 27 years, specializing in momentum trading with stocks and options.
PRINT THIS ARTICLE
TECHNICAL ANALYSIS
Price Action And The Basics Of Trading
01/13/12 01:49:01 PMby Billy Williams
The great Green Bay Packers coach, Vince Lombardi, was a big believer in the drilling of basics to his players. For traders, a solid foundation in trading fundamentals is just as invaluable.
Position: Hold
| Almost 25 years ago when I first started trading in the market, I read a story about the legendary football coach Vince Lombardi concerning a talk he had with his team after a loss. He took everyone out to the field and said something along the lines of, "Last night, we lost a game that was ours to win and we gave it away. If we lack the ability to execute our plays to perfection, I want you to know that is not your fault, it is my responsibility. So today, we begin again with the vital basics to build the foundation in order to execute perfectly so we do not have to suffer another unnecessary loss." Then he reached into a bag and pulled out a worn-out football and declared, "This is a football." And the team began to drill over and over again on the vital basics of the game till they began to execute them flawlessly once again. |

|
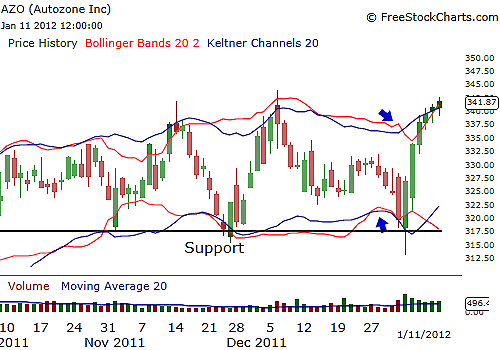
| FIGURE 1: AZO. AZO is a stock going through a period of strong contraction after a strong runup in price. Note how the Bollinger Bands reveal this strong price contraction by squeezing in between the Keltner channels as the stock trades near support, as marked by the blue arrows. |
| Graphic provided by: www.freestockcharts.com. |
| |
| Given Lombardi's enviable record over his long career, you could reasonably assume that he was on to something. Returning to the vital basics is about as much fun as watching paint dry but it is in the drudge work of refining the basic but vital skills of any profession that the real growth lies. So it is with trading and now, at the beginning of a new year, there can be no more ideal time than now to touch on the vital fundamentals that make up the basic tools that you need to learn to execute flawlessly in trading the market. |

|
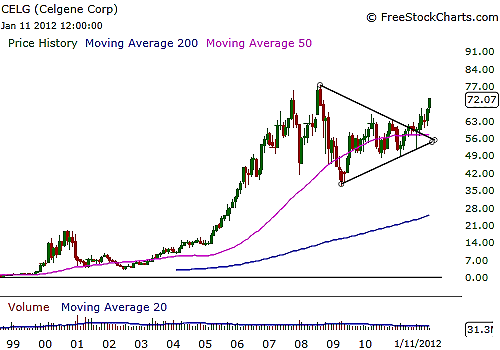
| FIGURE 2: CELG. CELG has been a stock going through a strong period of price expansion until the housing crisis in 2008 created a drag on its bull run, where it then underwent a period of price contraction. During that period of contraction, CELG formed a bullish triangle on its long-term trend. |
| Graphic provided by: www.freestockcharts.com. |
| |
| The first basic principle is that everything in the market breaks down to price action. Price is what you must concentrate on. In trading, you are an interpreter of price action, not a predictor. This one distinction in how you approach trading will make you or break you. More traders enter the market under the notion that they will read a few books or attend a few seminars and, magically, they will rise above all the trading greats. |

|
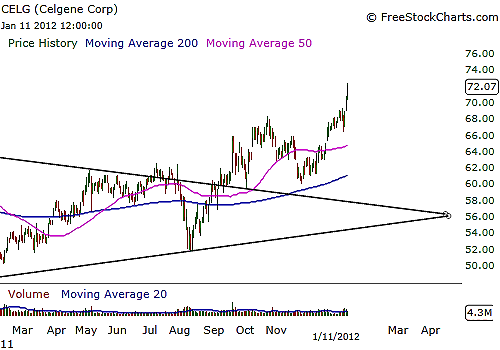
| FIGURE 3: CELG. By scrolling to a lower time frame, you can see CELG's price action emerge from this bullish triangle (price contraction) and resume its upward move (price expansion). |
| Graphic provided by: www.freestockcharts.com. |
| |
| Simply, price action is movement, and by looking at where price has been in the past in relation to what it is doing in the present, as a trader, you hope to exploit that price action in a profitable fashion. In addition, there are two main types of price action: contraction and expansion. See Figures 1, 2, and 3. |
| The market trades in a yin/yang fashion when one side -- bulls or bears -- has control of a stock's movement. As price begins to lose momentum, it enters a period of contraction where it forms a trading range. It is this natural ebb and flow of rising, falling, and going back and forth where new opportunities present themselves each day if you know what to look for. Now, what you need to do is begin looking at charts and note where price has clear movement and periods of contraction before resuming that movement. Once you train yourself to see these types of price action, you can learn how to time your entries and exits with greater precision while gaining a strong foundation of technical ability to build upon. |
Billy Williams has been trading the markets for 27 years, specializing in momentum trading with stocks and options.
| Company: | StockOptionSystem.com |
| E-mail address: | stockoptionsystem.com@gmail.com |
Traders' Resource Links | |
| StockOptionSystem.com has not added any product or service information to TRADERS' RESOURCE. | |
Click here for more information about our publications!
Comments

Request Information From Our Sponsors
- VectorVest, Inc.
- Executive Premier Workshop
- One-Day Options Course
- OptionsPro
- Retirement Income Workshop
- Sure-Fire Trading Systems (VectorVest, Inc.)
- Trading as a Business Workshop
- VectorVest 7 EOD
- VectorVest 7 RealTime/IntraDay
- VectorVest AutoTester
- VectorVest Educational Services
- VectorVest OnLine
- VectorVest Options Analyzer
- VectorVest ProGraphics v6.0
- VectorVest ProTrader 7
- VectorVest RealTime Derby Tool
- VectorVest Simulator
- VectorVest Variator
- VectorVest Watchdog
- StockCharts.com, Inc.
- Candle Patterns
- Candlestick Charting Explained
- Intermarket Technical Analysis
- John Murphy on Chart Analysis
- John Murphy's Chart Pattern Recognition
- John Murphy's Market Message
- MurphyExplainsMarketAnalysis-Intermarket Analysis
- MurphyExplainsMarketAnalysis-Visual Analysis
- StockCharts.com
- Technical Analysis of the Financial Markets
- The Visual Investor
