HOT TOPICS LIST
- MACD
- Fibonacci
- RSI
- Gann
- ADXR
- Stochastics
- Volume
- Triangles
- Futures
- Cycles
- Volatility
- ZIGZAG
- MESA
- Retracement
- Aroon
INDICATORS LIST
LIST OF TOPICS
PRINT THIS ARTICLE
by Andrew Hetherington
Yahoo has recovered, but there is an opportunity on the short side temporarily.
Position: N/A
Andrew Hetherington
Classic Dow Theorist who trades as a pure technician, using pattern recognition.
PRINT THIS ARTICLE
CHART ANALYSIS
Opportunity in Yahoo's Multiple Chart Formations
05/16/02 12:10:38 PMby Andrew Hetherington
Yahoo has recovered, but there is an opportunity on the short side temporarily.
Position: N/A
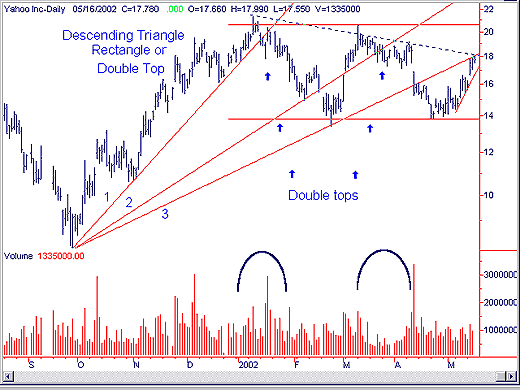
 Yahoo (YHOO) has recovered from its September low of $8.02 and has gotten as high as $21.35 in January, 2002. This recovery has been filled with uncertainty as have most equities over this period, and over the past six months it has been consolidating. |
| Currently, it has formed either a 6-month rectangle, 6-month descending triangle or a double top. All of these patterns are correct at this juncture, since we are still within the patterns. When the patterns are finally completed we will be able to diagnose which pattern it actually is. The volume is nicely diminished, a requirement for all of these patterns. We have had a third fan line break on April 11 to change the temporary direction from up to down. Now, it has been pulling back to the third fan line in the $18.00 area. Also, this pullback is colliding with the descending triangle line, which is the dotted blue line on the chart. |
| The double top, triangle and rectangle breakout line is in the $13.85 area. The volumes are diminished, as previously mentioned, but they are also significantly higher on the first top compared to the second top. You must consider the cumulative volume on the entire top, which encompasses several days. |
| To take advantage of this potential shorting opportunity, I suggest you trade it off of the top dotted line of the triangle and the pullback to the fan line. Although it could climb as high as the rectangle top line in the $20.00 area, it's unlikely. The resistance is strong in this area. The general market conditions have changed from down to up but a small throwback in the QQQ's is likely. |
| I suggest for those with a strong stomach to play within the pattern on this opportunity with your buy stop just above the line in the $18.28 area in case it goes in the wrong direction. I would also consider buying "Put" options in the $1.10 area for the June $17.50 strike price. These could easily double or triple if the equity drops to the $15.00 area by the end of next week. |
Classic Dow Theorist who trades as a pure technician, using pattern recognition.
| Toronto, Canada |
Click here for more information about our publications!
PRINT THIS ARTICLE

Request Information From Our Sponsors
- StockCharts.com, Inc.
- Candle Patterns
- Candlestick Charting Explained
- Intermarket Technical Analysis
- John Murphy on Chart Analysis
- John Murphy's Chart Pattern Recognition
- John Murphy's Market Message
- MurphyExplainsMarketAnalysis-Intermarket Analysis
- MurphyExplainsMarketAnalysis-Visual Analysis
- StockCharts.com
- Technical Analysis of the Financial Markets
- The Visual Investor
- VectorVest, Inc.
- Executive Premier Workshop
- One-Day Options Course
- OptionsPro
- Retirement Income Workshop
- Sure-Fire Trading Systems (VectorVest, Inc.)
- Trading as a Business Workshop
- VectorVest 7 EOD
- VectorVest 7 RealTime/IntraDay
- VectorVest AutoTester
- VectorVest Educational Services
- VectorVest OnLine
- VectorVest Options Analyzer
- VectorVest ProGraphics v6.0
- VectorVest ProTrader 7
- VectorVest RealTime Derby Tool
- VectorVest Simulator
- VectorVest Variator
- VectorVest Watchdog
