HOT TOPICS LIST
- MACD
- Fibonacci
- RSI
- Gann
- ADXR
- Stochastics
- Volume
- Triangles
- Futures
- Cycles
- Volatility
- ZIGZAG
- MESA
- Retracement
- Aroon
INDICATORS LIST
LIST OF TOPICS
PRINT THIS ARTICLE
by Donald W. Pendergast, Jr.
There are times to sell short and there are times to refrain from doing so. Keeping track of gap support and resistance can better help you make that decision.
Position: N/A
Donald W. Pendergast, Jr.
Donald W. Pendergast is a financial markets consultant who offers specialized services to stock brokers and high net worth individuals who seek a better bottom line for their portfolios.
PRINT THIS ARTICLE
DAY TRADING
Minding The Gap
01/13/12 01:38:00 PMby Donald W. Pendergast, Jr.
There are times to sell short and there are times to refrain from doing so. Keeping track of gap support and resistance can better help you make that decision.
Position: N/A
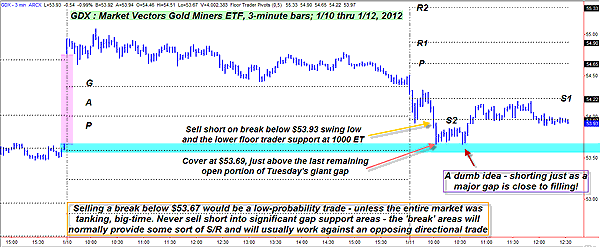
| Some days, an intraday short setup takes shape so wonderfully that you just have to try your hand at it (even though I am not a big proponent of trading in that manner, for a variety of reasons). That was certainly the case the morning of Thursday, January 12, when the Market Vectors Gold Miners ETF (GDX) opened lower, quickly dropped down to floor trader pivot S2 (meaning it is theoretical support level 2 for intraday trading purposes), had a weak bounce back up, and then began to break below S2 again. See Figure 1. Noticing the prior swing low at $53.93, I decided to short at $53.91, placing a sell-stop market order at that price. Since there was about 21 cents left until Tuesday morning's big open gap would be filled, it seemed like a very low-risk, in-and-out kind of a trade. GDX, volatile as it is on a three-minute chart, was very cooperative, quickly plunging down to $53.67, at which point I closed the trade out, covering at $53.69. Not exactly the kind of millions that the other Donald (THE Donald, as in Trump) regularly makes, but I was happy enough to cash in on such a simple trade setup. |

|
| FIGURE 1: GDX, THREE-MINUTE. This one chart lesson could be invaluable to daytraders who wonder why they get killed on at least some of their short trade setups, time after time. |
| Graphic provided by: TradeStation. |
| |
| Now, of course, we've all heard it so many times before -- "Let your profits run and cut your losers short" -- that we should know it by heart by now, but really, there are times that it pays to cut a winner short. The reason is easily explained by looking at the simple technical dynamics on the two charts shown; on the three-minute chart, note both the large open gap (pink shaded area) at Tuesday's open and then also take a glance at the lower edge of the open gap, which can frequently be a big-time area of support, highlighted in blue. Note how I closed the short trade out just as price was ready to hit that blue zone of gap support, and that GDX shortly thereafter began to consolidate before reversing higher again. I've seen this happen on many intraday charts before and knew that closing the trade near gap support was a no-brainer. The same situation applies in reverse, by the way; gap resistance is just as powerful a trading dynamic, one that should never be ignored. |

|
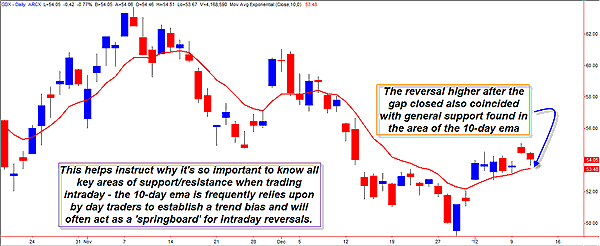
| FIGURE 2: GDX. Although it isn't as critical as the knowing where the gap support levels are, it still pays to monitor the value and direction of either the 10-day EMA or 10-day SMA, especially if you are a daytrader. |
| Graphic provided by: MetaStock. |
| |
| Finally, note that at the same time all of that action was occurring on the three-minute chart, the daily chart of GDX was also confirming yet another kind of support that intraday traders tend to take seriously -- that of the 10-day exponential moving average (EMA) or its 10-day simple moving average counterpart. These are frequently relied upon by daytraders to help determine the overall trading bias for their intraday trade setups. And this time, the 10-day EMA, with a value of $53.53, happened to closely coincide with the lower gap support level of $53.67. See Figure 2. It's not an exact match, but close enough to convince many daytraders that taking another shot on the short side in the vicinity of $53.70 to $53.55 just wasn't worth the risk. Now, mind you, this is a general example; situations can and will differ depending on the markets and time frames you trade, but for the most part it's very wise to never: 1. Sell short with prices just above a major daily moving average, especially the 10-day EMA or SMA 2. Sell short just above an area of major gap support. Long traders can simply invert those rules for their own trading. These simple rules may save you from unwanted and potentially destructive losses, particularly in the case of a short trade getting wiped out by a major short-covering rally right near -- you guessed it -- major gap support. |
| Sometimes, playing a good defense means staying out of the market when you identify a sound technical reason why you need to pass on a trade. And if there ever was one, avoiding going short near major gap support would have to be it, especially for intraday traders. |
Donald W. Pendergast is a financial markets consultant who offers specialized services to stock brokers and high net worth individuals who seek a better bottom line for their portfolios.
| Title: | Writer, market consultant |
| Company: | Linear Trading Systems LLC |
| Jacksonville, FL 32217 | |
| Phone # for sales: | 904-239-9564 |
| E-mail address: | lineartradingsys@gmail.com |
Traders' Resource Links | |
| Linear Trading Systems LLC has not added any product or service information to TRADERS' RESOURCE. | |
Click here for more information about our publications!
PRINT THIS ARTICLE

Request Information From Our Sponsors
- VectorVest, Inc.
- Executive Premier Workshop
- One-Day Options Course
- OptionsPro
- Retirement Income Workshop
- Sure-Fire Trading Systems (VectorVest, Inc.)
- Trading as a Business Workshop
- VectorVest 7 EOD
- VectorVest 7 RealTime/IntraDay
- VectorVest AutoTester
- VectorVest Educational Services
- VectorVest OnLine
- VectorVest Options Analyzer
- VectorVest ProGraphics v6.0
- VectorVest ProTrader 7
- VectorVest RealTime Derby Tool
- VectorVest Simulator
- VectorVest Variator
- VectorVest Watchdog
- StockCharts.com, Inc.
- Candle Patterns
- Candlestick Charting Explained
- Intermarket Technical Analysis
- John Murphy on Chart Analysis
- John Murphy's Chart Pattern Recognition
- John Murphy's Market Message
- MurphyExplainsMarketAnalysis-Intermarket Analysis
- MurphyExplainsMarketAnalysis-Visual Analysis
- StockCharts.com
- Technical Analysis of the Financial Markets
- The Visual Investor
