HOT TOPICS LIST
- MACD
- Fibonacci
- RSI
- Gann
- ADXR
- Stochastics
- Volume
- Triangles
- Futures
- Cycles
- Volatility
- ZIGZAG
- MESA
- Retracement
- Aroon
INDICATORS LIST
LIST OF TOPICS
PRINT THIS ARTICLE
by Chaitali Mohile
The bullish breakout of Buckeye Technologies is likely to slow down near the new high.
Position: Hold
Chaitali Mohile
Active trader in the Indian stock markets since 2003 and a full-time writer. Trading is largely based upon technical analysis.
PRINT THIS ARTICLE
TECHNICAL ANALYSIS
Buckeye At 52-Week High
01/13/12 01:25:05 PMby Chaitali Mohile
The bullish breakout of Buckeye Technologies is likely to slow down near the new high.
Position: Hold
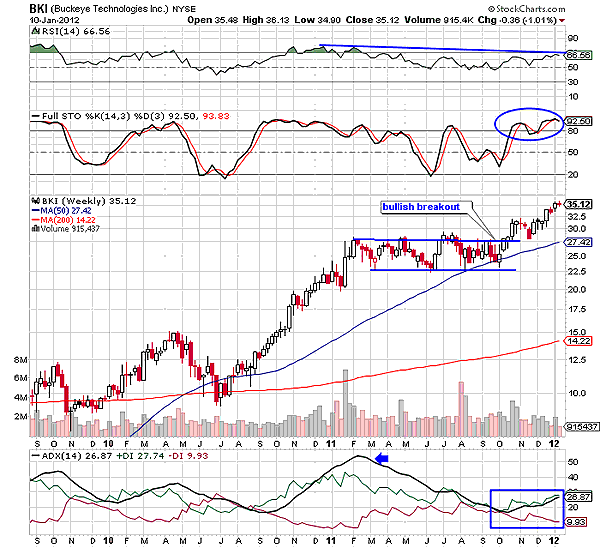
| An extremely overheated uptrend reversed a short-term bullish rally of Buckeye Technologies (BKI). The average directional index (ADX) (14) in Figure 1 reached 50 levels, indicating the uptrend reversal for BKI. The stock moved sideways as the uptrend plunged from overheated levels. Since the buying pressure was relatively stable, the descending uptrend could not harm the bullish sentiments. As a result, the stock consolidated in a stable range of 27 to 22, as seen in Figure 1. The advance rally followed by the sideways move formed a bullish flag & pennant -- a bullish continuation pattern. A bullish breakout of this pattern resulted in a resumption of the prior bullish rally. The pattern in Figure 1 has already broken upward. |

|
| FIGURE 1: BKI, WEEKLY |
| Graphic provided by: StockCharts.com. |
| |
| The relative strength index (RSI) (14) is reflecting a steady bullish strength by moving within the overbought zone (65 and 50). The full stochastic (14,3,3) surged above the 50 levels, suggesting a fresh buying opportunity for short-term traders. In addition, the uptrend developed during the breakout. Therefore, the breakout rally had good reasons to climb higher. |
| However, as BKI moved closer to a new high, RSI (14) showed negative divergence by forming a lower high in Figure 1. The stochastic oscillator is uncomfortable above 90 levels. Although this momentum indicator can remain overbought or oversold for a longer time, traders have to identify a perfect road map. Considering the current positions of both indicators, BKI is likely to slow down for a short time span. The small candles, upper and lower shadows, and the doji candlestick explain the sluggish price action of BKI. |

|
| FIGURE 2: BKI, MONTHLY |
| Graphic provided by: StockCharts.com. |
| |
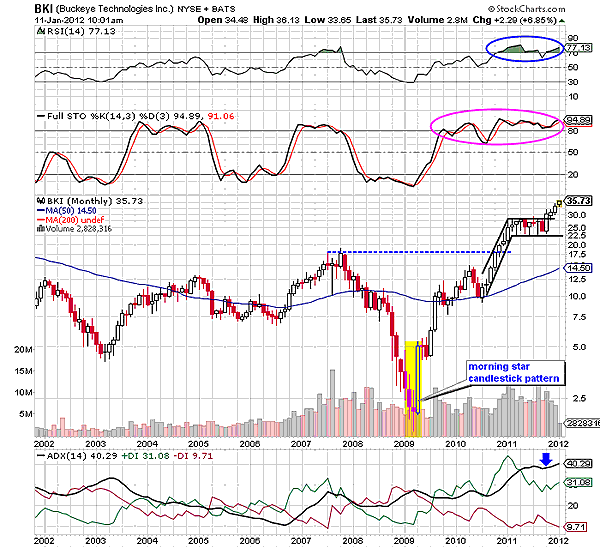
| A pullback rally initiated by a morning star candlestick pattern in 2009 eventually converted the 50-day moving average resistance to support. Later, it also breached a previous high resistance at 17.5 levels. The breakout rally, however, turned weak. The bullish candles above the dotted line in Figure 2 have upper as well as lower shadows, suggesting the inability to sustain near the intermediate high and low. We can also see doji candlesticks, showing uncertainty in the rally. The RSI (14) and stochastic oscillator are overbought but not reflecting any reversal indication. The ADX (14) is overheated and can continue its journey in the same area for the longer period. Therefore, the breakout of the bullish flag & pennant pattern in Figure 2 would maintain its bullishness in these extreme conditions. The highly bullish indicators can decline marginally to create some room for the future rally. This can affect the speed of the rally but the bullish momentum would sustain. Thus, it is likely that long positions would get whipsawed. |
| Here, we can measure the target of the breakout rally by adding the length of a flag pole to the breakout point; 25 - 10 = 15 + 25 = 40 is the potential target for BKI. The stock has already moved closer to the minimum estimated levels, which adds another reason for the slowdown. Since BKI is technically strong, traders and investors can book partial profits near $38 and carry forward the balance trade. To conclude, BKI would marginally slow down near the 52-week high level due to extremely bullish indicators, but maintain its bullish hold. |
Active trader in the Indian stock markets since 2003 and a full-time writer. Trading is largely based upon technical analysis.
| Company: | Independent |
| Address: | C1/3 Parth Indraprasth Towers. Vastrapur |
| Ahmedabad, Guj 380015 | |
| E-mail address: | chaitalimohile@yahoo.co.in |
Traders' Resource Links | |
| Independent has not added any product or service information to TRADERS' RESOURCE. | |
Click here for more information about our publications!
PRINT THIS ARTICLE

Request Information From Our Sponsors
- StockCharts.com, Inc.
- Candle Patterns
- Candlestick Charting Explained
- Intermarket Technical Analysis
- John Murphy on Chart Analysis
- John Murphy's Chart Pattern Recognition
- John Murphy's Market Message
- MurphyExplainsMarketAnalysis-Intermarket Analysis
- MurphyExplainsMarketAnalysis-Visual Analysis
- StockCharts.com
- Technical Analysis of the Financial Markets
- The Visual Investor
- VectorVest, Inc.
- Executive Premier Workshop
- One-Day Options Course
- OptionsPro
- Retirement Income Workshop
- Sure-Fire Trading Systems (VectorVest, Inc.)
- Trading as a Business Workshop
- VectorVest 7 EOD
- VectorVest 7 RealTime/IntraDay
- VectorVest AutoTester
- VectorVest Educational Services
- VectorVest OnLine
- VectorVest Options Analyzer
- VectorVest ProGraphics v6.0
- VectorVest ProTrader 7
- VectorVest RealTime Derby Tool
- VectorVest Simulator
- VectorVest Variator
- VectorVest Watchdog
