HOT TOPICS LIST
- MACD
- Fibonacci
- RSI
- Gann
- ADXR
- Stochastics
- Volume
- Triangles
- Futures
- Cycles
- Volatility
- ZIGZAG
- MESA
- Retracement
- Aroon
INDICATORS LIST
LIST OF TOPICS
PRINT THIS ARTICLE
by Donald W. Pendergast, Jr.
Shares of United Rentals continue their march higher, and the technicals suggest further upside is possible.
Position: Accumulate
Donald W. Pendergast, Jr.
Donald W. Pendergast is a financial markets consultant who offers specialized services to stock brokers and high net worth individuals who seek a better bottom line for their portfolios.
PRINT THIS ARTICLE
TRADING SYSTEMS
United Rentals Moving On Up
01/12/12 09:06:26 AMby Donald W. Pendergast, Jr.
Shares of United Rentals continue their march higher, and the technicals suggest further upside is possible.
Position: Accumulate
| It's got to be tough for what I call the "oscillator people" -- you know, the ones who seem to believe that every time the 14-period relative strength index (RSI) hits 70 or 75, it's time to sell a rally or a drop down to 25 means it's a grand buying opportunity. Now, of course, there are times when using that kind of a trading methodology can and will bring home steady profits; a sideways, choppy market with no trending characteristics is the kind of market you want to use such a strategy in. However, when a market goes into a confirmed trend, you might actually make more money by adopting a more long-term outlook, using a volatility-based trailing stop as a way to keep you in for the majority of the move. That might still be the way to go for bulls who've been trading/investing in shares of United Rentals (URI) over the past five months or so. Here's a closer look at this stock's powerful trend (Figure 1). |

|
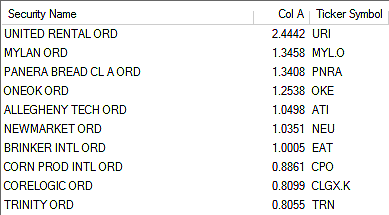
| FIGURE 1: TOP 10 STOCKS. The top 10 RMO swing buy signal stocks for January 10, 2012, based on their relative strength versus the .SPX. |
| Graphic provided by: MetaStock. |
| Graphic provided by: MetaStock Explorer. |
| |
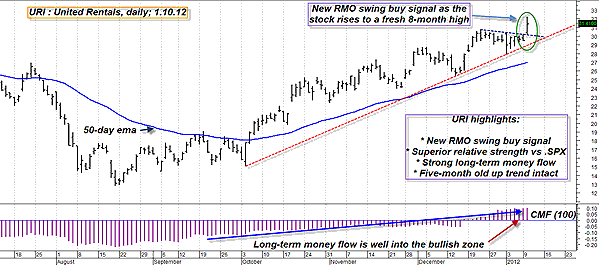
| URI's current uptrend got going in a series of fits and starts, finally gaining some real traction once the broad market indexes finally made a major low and then reversed higher on October 4, 2011. From its own major low of $12.81 on August 19, 2011, the stock has risen by more than 145%. That's not a misprint! And the crazy thing is, this unglamorous, basic service industry stock looks like it's primed for yet another run higher, particularly if the new Rahul Mohindar (RMO) buy signal bar's high of $32.21 gets exceeded within the next couple of trading sessions. Long-term money flow (based on the trusty 100-period Chaikin money flow [CMF][100] histogram) is in the solidly bullish camp, the series of higher swing highs and higher swing lows is generally intact, as is the long term uptrend line. Prices are comfortably above their 50-day exponential moving average (EMA) and the stock boasts extraordinarily strong relative strength versus the .SPX. All in all, if you're bullish on this stock, this could be yet another great buying op. See Figure 2. |

|
| FIGURE 2: URI, DAILY. Clearly, the line of least resistance in this stock is toward higher valuations. A strong uptrend, great money flow, and powerful relative strength all combine to make an attractive place for bulls to deploy some cash. |
| Graphic provided by: MetaStock. |
| |
| Covered calls might be one way to go long here, given the long-term, sustained uptrend; you might be able to use the stock's 21-day EMA as some sort of trailing stop-loss for such a covered-call position. Stock-only traders might want to wait for a break above the RMO signal bar's high of $32.21, making sure of the stock's intentions by only buying on strength. A three-bar trailing stop of the daily lows might be one stress-free way to manage such a position until the final stopout. Incidentally, there were an unusually large number of RMO swing buy signals in the .SPX component stock list on Tuesday, meaning that we might be about to see a significant near-term market rally -- possibly one as dramatic as the one that occurred in October 2011. Take some time and examine the top relative strength stocks listed here and see which ones look the most attractive to you and then start to build your positions again in the market. |
Donald W. Pendergast is a financial markets consultant who offers specialized services to stock brokers and high net worth individuals who seek a better bottom line for their portfolios.
| Title: | Writer, market consultant |
| Company: | Linear Trading Systems LLC |
| Jacksonville, FL 32217 | |
| Phone # for sales: | 904-239-9564 |
| E-mail address: | lineartradingsys@gmail.com |
Traders' Resource Links | |
| Linear Trading Systems LLC has not added any product or service information to TRADERS' RESOURCE. | |
Click here for more information about our publications!
Comments

Request Information From Our Sponsors
- StockCharts.com, Inc.
- Candle Patterns
- Candlestick Charting Explained
- Intermarket Technical Analysis
- John Murphy on Chart Analysis
- John Murphy's Chart Pattern Recognition
- John Murphy's Market Message
- MurphyExplainsMarketAnalysis-Intermarket Analysis
- MurphyExplainsMarketAnalysis-Visual Analysis
- StockCharts.com
- Technical Analysis of the Financial Markets
- The Visual Investor
- VectorVest, Inc.
- Executive Premier Workshop
- One-Day Options Course
- OptionsPro
- Retirement Income Workshop
- Sure-Fire Trading Systems (VectorVest, Inc.)
- Trading as a Business Workshop
- VectorVest 7 EOD
- VectorVest 7 RealTime/IntraDay
- VectorVest AutoTester
- VectorVest Educational Services
- VectorVest OnLine
- VectorVest Options Analyzer
- VectorVest ProGraphics v6.0
- VectorVest ProTrader 7
- VectorVest RealTime Derby Tool
- VectorVest Simulator
- VectorVest Variator
- VectorVest Watchdog
