HOT TOPICS LIST
- MACD
- Fibonacci
- RSI
- Gann
- ADXR
- Stochastics
- Volume
- Triangles
- Futures
- Cycles
- Volatility
- ZIGZAG
- MESA
- Retracement
- Aroon
INDICATORS LIST
LIST OF TOPICS
PRINT THIS ARTICLE
by Mike Carr, CMT
Based on characteristics of past stock market winners, we can find stocks that appear to be set up for gains in the year ahead.
Position: Buy
Mike Carr, CMT
Mike Carr, CMT, is a member of the Market Technicians Association, and editor of the MTA's newsletter, Technically Speaking. He is also the author of "Smarter Investing in Any Economy: The Definitive Guide to Relative Strength Investing," and "Conquering the Divide: How to Use Economic Indicators to Catch Stock Market Trends."
PRINT THIS ARTICLE
RSI
Potential Winners For 2012
01/10/12 08:43:23 AMby Mike Carr, CMT
Based on characteristics of past stock market winners, we can find stocks that appear to be set up for gains in the year ahead.
Position: Buy
| Technical analysis involves studying the past to identify patterns that are likely to be repeated in the future. This usually leads traders to a review of charts where emotional responses like fear and greed are captured. Chart patterns often do repeat, and there are a number of widely recognized chart patterns that traders follow, including the head & shoulders formation and triangles. This same idea can be applied to any market characteristic in the same way as it would be with price charts. Historical patterns of sales and earnings could be studied, for example. In doing so, several common characteristics of big stock market winners can be identified. The biggest winners from the past have tended to start their big runups in price from a low price level and occur in companies with a record of sales and earnings growth. Based on this, three stocks that show strong potential to deliver big gains in the year ahead are Edac Technologies (EDAC), Arabian American Development Co. (ARSD), and Natural Alternatives International (NAII). These three companies pass the simple screen of stock price gains coupled with sales and earnings growth, and each would require more research before making an investment. |
| EDAC makes a variety of products that are used in aircraft engines and turbines. Revenue grew by nearly 18% in the last quarter, while earnings posted an unsustainable quadruple-digit growth rate. Typical for a company of this size, there are no analyst estimates available to help investors evaluate future earnings potential. The market cap is very small, slightly more than $50 million, which makes the stock difficult to trade. Average daily volume has been around 30,000 shares a day. It is possible to trade a stock like this by using limit orders to enter and exit the position. |

|
| FIGURE 1: EDAC, WEEKLY. EDAC shows the impact of thin trading with large price moves both up and down visible on the chart. |
| Graphic provided by: Trade Navigator. |
| |
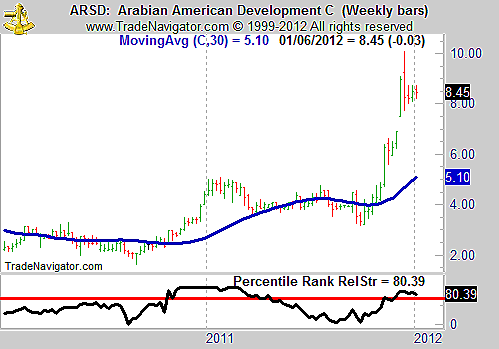
| ARSD highlights another difficulty in trading these stocks. There was recently a sharp move to the upside, and many traders are reluctant to buy stocks that have just reached significant new highs and appear to be overbought. Although ARSD is well above its moving average, the relative strength is only near 80. This indicator is calculated to show where an individual stock's RS is in relation to all other possible investments. Strong stocks tend to have high RS ranks, and the rank stays high during strong and sustained market moves. A value of 80 in this indicator can be considered a buy point. |

|
| FIGURE 2: ARSD, WEEKLY. ARSD shows a pattern of smaller price ranges in recent weeks, a possible sign that the stock is consolidating its recent gains. |
| Graphic provided by: Trade Navigator. |
| |
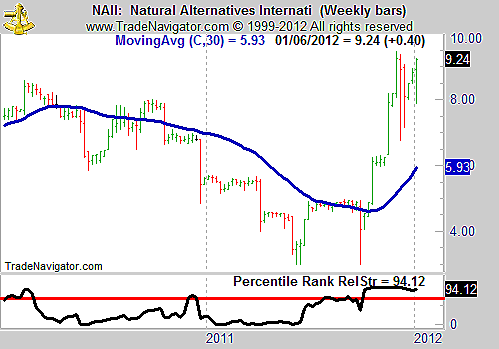
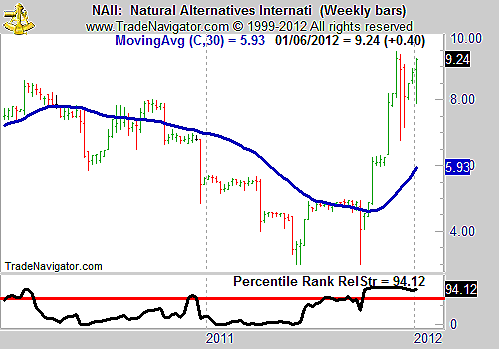
| NAII provides private label contract manufacturing services to companies that market and distribute vitamins, minerals, herbs, and other nutritional supplements, as well as other health care products to consumers in the US and internationally. This business looks like it could be a sustained growth story. Sales topped $60 million in the past 12 months, with revenue growth of 37% driving earnings growth of 67%. The chart of NAII shows the rapid growth in the stock price and high RS seen in other past winners. |

|
| FIGURE 3: NAII, WEEKLY. NAII is trading near a multiyear high and shows a very high relative strength rank. |
| Graphic provided by: Trade Navigator. |
| |
| These stocks may or may not be among the next big stock market winners. However, they do offer a useful starting point for analysis. They all have low prices and strong fundamentals, along with high relative strength. |
Mike Carr, CMT, is a member of the Market Technicians Association, and editor of the MTA's newsletter, Technically Speaking. He is also the author of "Smarter Investing in Any Economy: The Definitive Guide to Relative Strength Investing," and "Conquering the Divide: How to Use Economic Indicators to Catch Stock Market Trends."
| Website: | www.moneynews.com/blogs/MichaelCarr/id-73 |
| E-mail address: | marketstrategist@gmail.com |
Click here for more information about our publications!
PRINT THIS ARTICLE

|

Request Information From Our Sponsors
- StockCharts.com, Inc.
- Candle Patterns
- Candlestick Charting Explained
- Intermarket Technical Analysis
- John Murphy on Chart Analysis
- John Murphy's Chart Pattern Recognition
- John Murphy's Market Message
- MurphyExplainsMarketAnalysis-Intermarket Analysis
- MurphyExplainsMarketAnalysis-Visual Analysis
- StockCharts.com
- Technical Analysis of the Financial Markets
- The Visual Investor
- VectorVest, Inc.
- Executive Premier Workshop
- One-Day Options Course
- OptionsPro
- Retirement Income Workshop
- Sure-Fire Trading Systems (VectorVest, Inc.)
- Trading as a Business Workshop
- VectorVest 7 EOD
- VectorVest 7 RealTime/IntraDay
- VectorVest AutoTester
- VectorVest Educational Services
- VectorVest OnLine
- VectorVest Options Analyzer
- VectorVest ProGraphics v6.0
- VectorVest ProTrader 7
- VectorVest RealTime Derby Tool
- VectorVest Simulator
- VectorVest Variator
- VectorVest Watchdog
