HOT TOPICS LIST
- MACD
- Fibonacci
- RSI
- Gann
- ADXR
- Stochastics
- Volume
- Triangles
- Futures
- Cycles
- Volatility
- ZIGZAG
- MESA
- Retracement
- Aroon
INDICATORS LIST
LIST OF TOPICS
PRINT THIS ARTICLE
by Matt Blackman
Netflix has been pummeled in the last few months but as 2011 ended and 2012 began, the stock began to show some signs of life.
Position: Buy
Matt Blackman
Matt Blackman is a full-time technical and financial writer and trader. He produces corporate and financial newsletters, and assists clients in getting published in the mainstream media. He is the host of TradeSystemGuru.com. Matt has earned the Chartered Market Technician (CMT) designation. Find out what stocks and futures Matt is watching on Twitter at www.twitter.com/RatioTrade
PRINT THIS ARTICLE
ACCELERATION
Is The Worst Finally Over For Netflix?
01/10/12 08:22:13 AMby Matt Blackman
Netflix has been pummeled in the last few months but as 2011 ended and 2012 began, the stock began to show some signs of life.
Position: Buy
| On July 13, 2011, Internet movie subscription company Netflix (NFLX) put in an all-time high of $304.79, but then something happened. We will never know for sure exactly what caused the stock to fall out of bed, but it had something to due with the company's move to separate its DVD rental by mail and movie streaming service into two separate businesses, which effectively doubled the cost of the service to subscribers who wanted both. In retrospect, it is easy to see that the move was a public relations nightmare. |

|
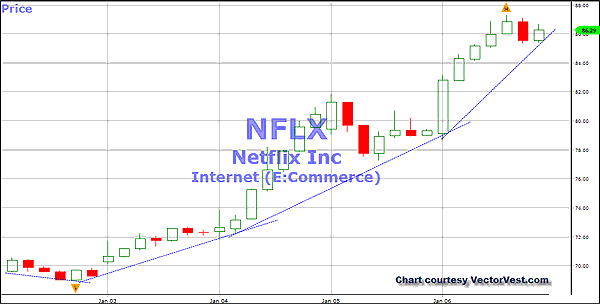
| FIGURE 1: NFLX, HOURLY. A 60-minute chart on VectorVest 7 program shows accelerating trendlines, demonstrating the rapid pickup in momentum since the new year began. |
| Graphic provided by: VectorVest.com. |
| |
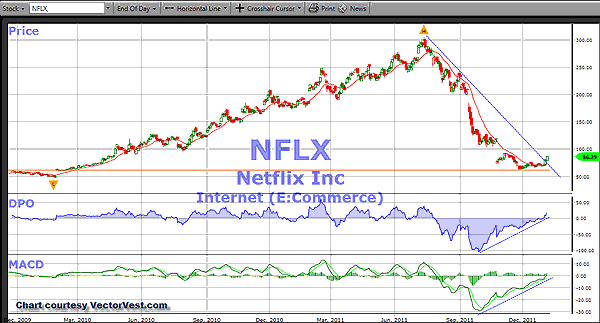
| Over the next four months, the stock price dropped nearly 80% to put in a low on November 29 of $62.37. More than a few analysts wrote the company off as a has-been. But the stock charts in Figure 1 and 2 show that someone began buying the shares and the stock bounced off strong long-term support (see horizontal orange line in Figure 2). A look at the 60-minute chart in Figure 1 shows a series of steepening trendlines have developed that show how momentum has accelerated since the beginning of the new year. |
| A look at the longer-term chart in Figure 2 shows how the detrended price oscillator and the moving average convergence/divergence (MACD) have positively diverged with price (see blue dashed lines), which is another indication of accumulation. Then on January 6, the long-term downtrend line was broken to the upside, triggering a trendline buy signal. |

|
| FIGURE 2: NFLX, DAILY. Here's a chart showing the longer-term picture for Netflix. Note the long-term support at $62.50 that was momentarily broken intraday on November 29 and rapid snapback as well as positive divergence between price and the detrended price oscillator (DPO) and MACD. |
| Graphic provided by: VectorVest.com. |
| |
| Technicals are just one of three factors that bode well for NFLX, which I will be discussing in an upcoming Working Money article. Could the stock make an attempt on its prior highs above $300? That remains to be seen. But even the best supporting data doesn't guarantee that the price will go up, which is why traders should never buy and forget. Stocks that have been so heavily pummeled rarely return to their previous glory, and there are a number of challenges facing the overall economy and markets that will have to be addressed if this nascent rally is to last longer than a few days or weeks at best. |
| For this reason, traders should view Netflix as a shorter-term trade and employ strict stop-losses and money management in any trade. This is a very volatile stock, and not one for the faint of heart or pocketbook! |
Matt Blackman is a full-time technical and financial writer and trader. He produces corporate and financial newsletters, and assists clients in getting published in the mainstream media. He is the host of TradeSystemGuru.com. Matt has earned the Chartered Market Technician (CMT) designation. Find out what stocks and futures Matt is watching on Twitter at www.twitter.com/RatioTrade
| Company: | TradeSystemGuru.com |
| Address: | Box 2589 |
| Garibaldi Highlands, BC Canada | |
| Phone # for sales: | 604-898-9069 |
| Fax: | 604-898-9069 |
| Website: | www.tradesystemguru.com |
| E-mail address: | indextradermb@gmail.com |
Traders' Resource Links | |
| TradeSystemGuru.com has not added any product or service information to TRADERS' RESOURCE. | |
Click here for more information about our publications!
PRINT THIS ARTICLE

Request Information From Our Sponsors
- StockCharts.com, Inc.
- Candle Patterns
- Candlestick Charting Explained
- Intermarket Technical Analysis
- John Murphy on Chart Analysis
- John Murphy's Chart Pattern Recognition
- John Murphy's Market Message
- MurphyExplainsMarketAnalysis-Intermarket Analysis
- MurphyExplainsMarketAnalysis-Visual Analysis
- StockCharts.com
- Technical Analysis of the Financial Markets
- The Visual Investor
- VectorVest, Inc.
- Executive Premier Workshop
- One-Day Options Course
- OptionsPro
- Retirement Income Workshop
- Sure-Fire Trading Systems (VectorVest, Inc.)
- Trading as a Business Workshop
- VectorVest 7 EOD
- VectorVest 7 RealTime/IntraDay
- VectorVest AutoTester
- VectorVest Educational Services
- VectorVest OnLine
- VectorVest Options Analyzer
- VectorVest ProGraphics v6.0
- VectorVest ProTrader 7
- VectorVest RealTime Derby Tool
- VectorVest Simulator
- VectorVest Variator
- VectorVest Watchdog
