

HOT TOPICS LIST
- MACD
- Fibonacci
- RSI
- Gann
- ADXR
- Stochastics
- Volume
- Triangles
- Futures
- Cycles
- Volatility
- ZIGZAG
- MESA
- Retracement
- Aroon
INDICATORS LIST
LIST OF TOPICS
PRINT THIS ARTICLE
by Koos van der Merwe
The Par Pharmaceutical chart is showing an inverse head & shoulders pattern.
Position: Buy
Koos van der Merwe
Has been a technical analyst since 1969, and has worked as a futures and options trader with First Financial Futures in Johannesburg, South Africa.
PRINT THIS ARTICLE
HEAD & SHOULDERS
Par Pharma Has An Inverse H&S
01/10/12 08:10:16 AMby Koos van der Merwe
The Par Pharmaceutical chart is showing an inverse head & shoulders pattern.
Position: Buy
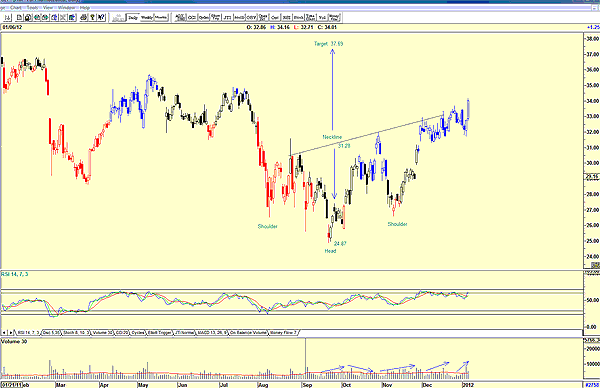
| The head & shoulders formation is one of the most common and also one of the most reliable of all major reversal patterns. It consists of a left shoulder, a head, and a right shoulder. The head & shoulders bottom formation is simply the inverse of a head & shoulders top and often indicates a trend reversal from down to top. Volume should pick up as prices rally from the bottom of the head and then increase on the rally from the right shoulder. If the breaking of the neckline is done on low volume, then the pattern becomes suspect. |
|
| FIGURE 1: PAR PHARMA. Par Pharmaceuticals is showing the head & shoulders pattern. |
| Graphic provided by: AdvancedGET. |
| |
| Figure 1 shows the inverse head & shoulders pattern. The target suggested is $37.69 (31.28 - 24.87 = 6.41 + 31.28 = 37.69). Note how volume increased as the price broke above the neckline, confirming the pattern. The relative strength index (RSI), however, does appear to be at overbought levels, but a sell signal has not been given. |
|
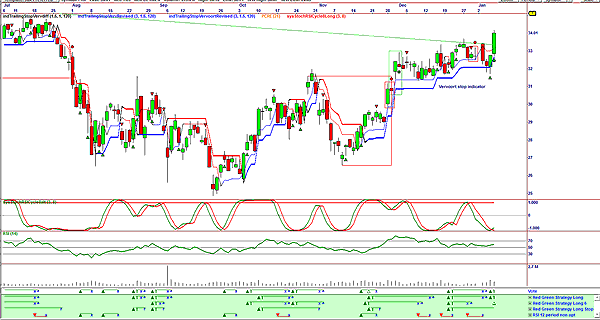
| FIGURE 2: PAR PHARMA. This chart shows buy signals. |
| Graphic provided by: Omnitrader. |
| |
| Figure 2 shows the following: 1. The stop Indicator. This is a stop signal that follows the rising price. Should the price break below this signal, you should sell the share. Note how reliable the stop indicator has been. 2. The stochastic RSI cycle indicator is suggesting a buy signal. 3. The 14-period RSI did give a sell signal earlier but could be turning up. 4. The vote line, a combination of the four strategies shown below the vote line, has given a buy signal. The charts of Par Pharmaceutical has suggested a buy signal, with a target of $37.69. I would be a buyer on any correction. |
Has been a technical analyst since 1969, and has worked as a futures and options trader with First Financial Futures in Johannesburg, South Africa.
| Address: | 3256 West 24th Ave |
| Vancouver, BC | |
| Phone # for sales: | 6042634214 |
| E-mail address: | petroosp@gmail.com |
Click here for more information about our publications!
PRINT THIS ARTICLE

Request Information From Our Sponsors
- StockCharts.com, Inc.
- Candle Patterns
- Candlestick Charting Explained
- Intermarket Technical Analysis
- John Murphy on Chart Analysis
- John Murphy's Chart Pattern Recognition
- John Murphy's Market Message
- MurphyExplainsMarketAnalysis-Intermarket Analysis
- MurphyExplainsMarketAnalysis-Visual Analysis
- StockCharts.com
- Technical Analysis of the Financial Markets
- The Visual Investor
- VectorVest, Inc.
- Executive Premier Workshop
- One-Day Options Course
- OptionsPro
- Retirement Income Workshop
- Sure-Fire Trading Systems (VectorVest, Inc.)
- Trading as a Business Workshop
- VectorVest 7 EOD
- VectorVest 7 RealTime/IntraDay
- VectorVest AutoTester
- VectorVest Educational Services
- VectorVest OnLine
- VectorVest Options Analyzer
- VectorVest ProGraphics v6.0
- VectorVest ProTrader 7
- VectorVest RealTime Derby Tool
- VectorVest Simulator
- VectorVest Variator
- VectorVest Watchdog